As the recent developments of financial markets playing accordingly to our initial projections, such as the 14% drop in the S&P 500, the 24% drop in the NASDAQ 100, the 9.7% drop in the Dow Jones, the Fed’s moderate normalization policy, and unwinding liquidity in the digital asset class, the commodity markets outperformed our consensus.
We attribute this performance in commodities (.. or inflation to be frank) to the financial market illiquidity that has perpetuated supply chain constraints despite the classical assumption that tighter financial conditions yield an “easing” effect on supply chains via demand reduction contrary to the popular belief that US inflation is demand driven. For context, real consumer spending has grown 2.6% per annum since the pandemic, in which the pre- pandemic levels saw a 2.4% growth rate (2 years leading).
Deep dive into the Components
When we look at CPI composition it is no mystery that energy was by far the largest contribution to the 8.3% YTD print for April 2022 with the energy index rising 30.3 percent over the past 12 months, the gasoline index increasing 43.6 percent, the fuel oil index rising 80.5 percent, and the index for natural gas increasing 22.7 percent over the last 12 months (04/21-04/22). Where supply-side constraints have been levied by historically low E&P CapEx in the sector, oil and gas firms have been “running on fumes” from an inventory standpoint as well as the sector from an aggregated standpoint. Even though inventory turnover has been generally well in this environment, many firms would like to take advantage of the current prices (given that consumers buy at spot prices), and the only way to increase supply sources in a timely manner is to embark on an aggressive increase in E&P CapEx (I.e., Venture Global’s $3.4 billion Plaquemines LNG Project). This only is done at the opportunity cost of taking advantage of the recent remarkable equity outperformance via capital restructuring in aim to add perpetuity to free-cash-flow yields; in which could create a goldilocks environment for oil and gas investors as this could prolong market price trends and prove as a hedge for firms against the 1m/6m spread in oil futures sitting at around $24/bbl (which indicates that oil futures are pricing in our initial scenario of increased CapEx, and or potential demand destruction).
Agricultural goods have been no different from energy as the food at home index rose 10.8 percent over the last 12 months, which is the largest 12-month increase since the period ending November 1980. The index for meats, poultry, fish, and eggs increased 14.3 percent over the last year, the largest 12-month increase since the period ending May 1979. The other major grocery store food group indexes also rose over the past year, with increases ranging from 7.8 percent (fruits and vegetables) to 11.0 percent (other food at home).
It is key to notice the spread on corn to contextualize the supply-side of agriculture as corn poses as the largest input good for agricultural products. The 1m/6m spread is right at $37; thus indicating a similar dynamic that we see in the energy markets in respects to the approach to the supply-side woes, with some endogenous factors such as variable costs associated with logistics and feed consumption.
Notable Headwinds
As rational as the hypothetical solutions to the commodity supply-side constraints may be, there are significant headwinds that will challenge firms and the aggregate economy. As briefly mentioned before, the supply side can only experience substantial growth via capital structure mechanisms (debt or equity financing), but liquidity (volume) is inextricably low in these markets.
Debt markets
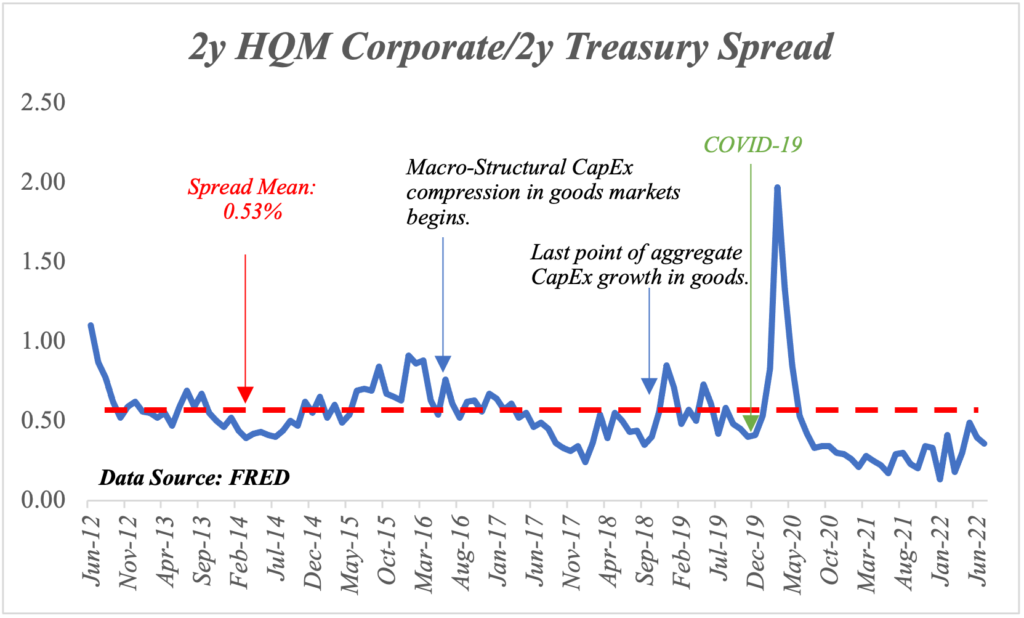
Open interest in the 2y treasury market is down 4.32% in the past year, and with 2- year high-quality corporate bond/2-year treasury bond spreads at extremely tight levels (see Figure 1), investors don’t have the risk premium that they usually do to position themselves in corporate bonds. Pairing this dynamic with the low liquidity in the comparable treasury market, it is safe to extrapolate that intermediate -term funding facility utility will continue to shrink for corporates.

Equity markets
Equity Markets follow a slightly similar trend as debt markets, but with an ever so slightly more upbeat tone. Equity market trading volume is up 43% YTD (composition of Dow Jones, SP500, and NASDAQ indexes). Equity issuance is down 79.5% Y/Y which can be attributed by fee expansion from intermediaries passing down increased variable, and operating costs on their clients (corporates).
This dynamic may constrain and de-incentivize firms to leverage equity financing for needed expansion, and in-turn may perpetuate supply-side constraints on the economy.
Economic “Hurricane” ?
With the given assessments made, all extrapolations lead to higher price levels throughout H2 2022, but as we all know the Federal Reserve remains committed to reducing inflation, and it is always safe to assume that in the midst of an election year, policymakers will be ultra-incentivized to combat inflation as well. This ultimately points us to the outcome that demand destruction will be required to alleviate price pressures regardless of how much of a culprit consumers are relative to the supply-side; this is ultimately a recipe for substantial pressures on the broad economy, and possibly akin to the “economic hurricane” JP Morgan’s CEO Jamie Dimon discussed.
Overall growth is at risk to underperform consensus growth for the next year, and the notion that we are in the later portion of the economic cycle is well confirmed. Recession or not, the US economy is heading for turbulence, albeit its remarkable performance vs. the rest of the world post-pandemic.


