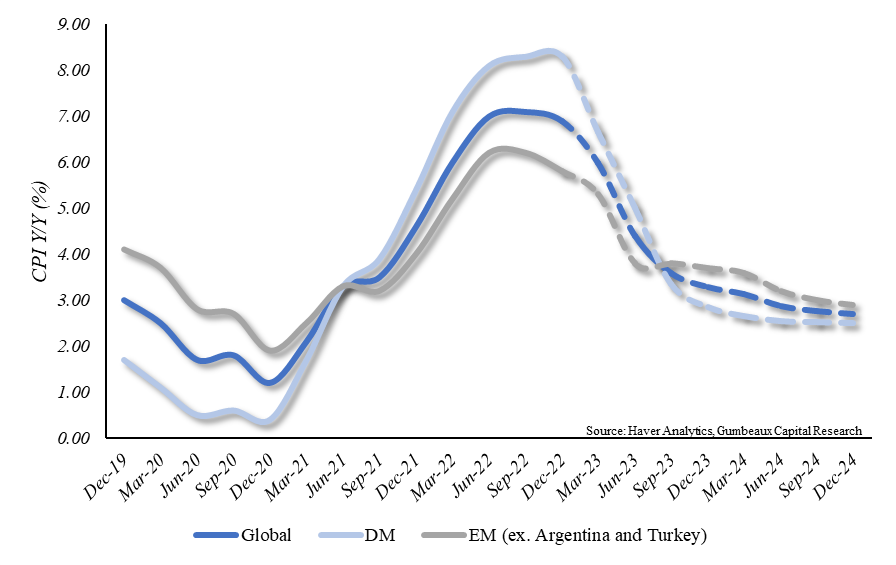
The headwinds that we expect to persist throughout 2023 will be derived from the “re-emergence” of the Phillips Curve as we see central banks continue to relentlessly fight inflation. Regarding inflationary pressures, we expect the aggregate central bank regime to tame inflation, but we believe that the post-COVID inflation has become sticky leaving us with relatively higher price levels going forward. Moreover, we observe through our projections that we can expect to see a larger delta for sticky inflation in developed markets versus emerging markets (see Exhibit A).
Exhibit A: While we expect inflation to “cool”, we also expect relatively higher price levels for the long haul.
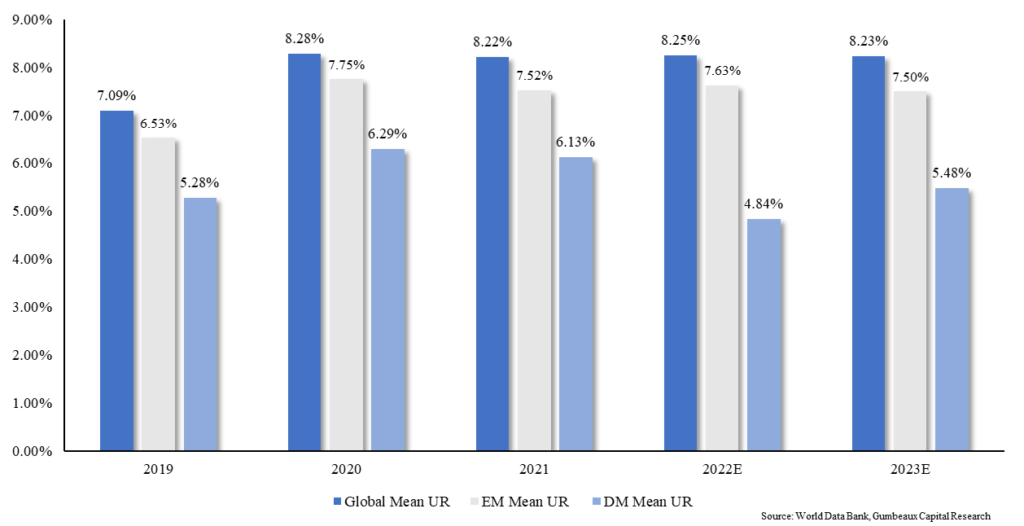
While price levels looked to have peaked in the latter half of 2022 via monetary policy shifts where we saw central banks across emerging and developed markets raise interest rates (see Exhibit B), many investors now have eyes on the effects that such a shift will impose on the broader economy going forward. With respect to the Phillips Curve, we want to take into account unemployment figures. Throughout 2022, as we start to see inflation cool off, we expect to see slightly elevated levels of unemployment 2022 across the broader economy (see Exhibit C). In 2023 we expect to see polarizing results for developed markets versus emerging markets which signals that we will see further convexity within the emerging markets Phillips Curve, but slightly increased concavity for the developed markets Phillips Curve.
Exhibit B: Central banks have collectively raised interest rates in pursuit of policy normalization.
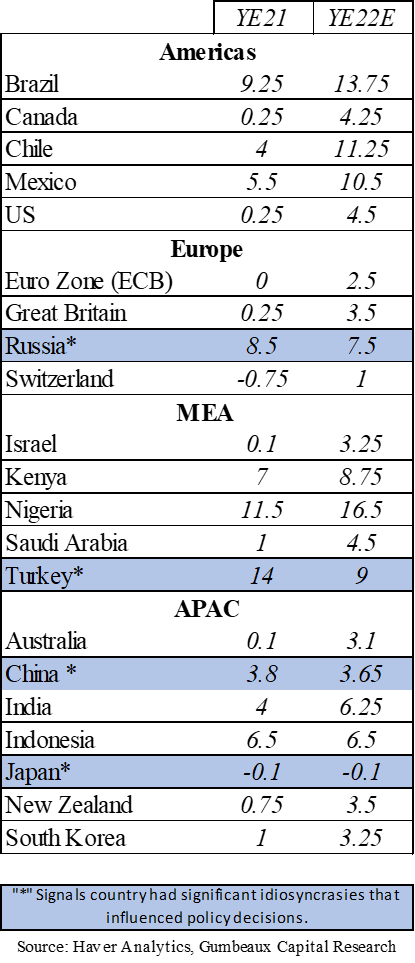
Exhibit C: Our expectations for mean unemployment figures suggest polarizing Phillips Curve outcomes for developed markets and emerging markets.
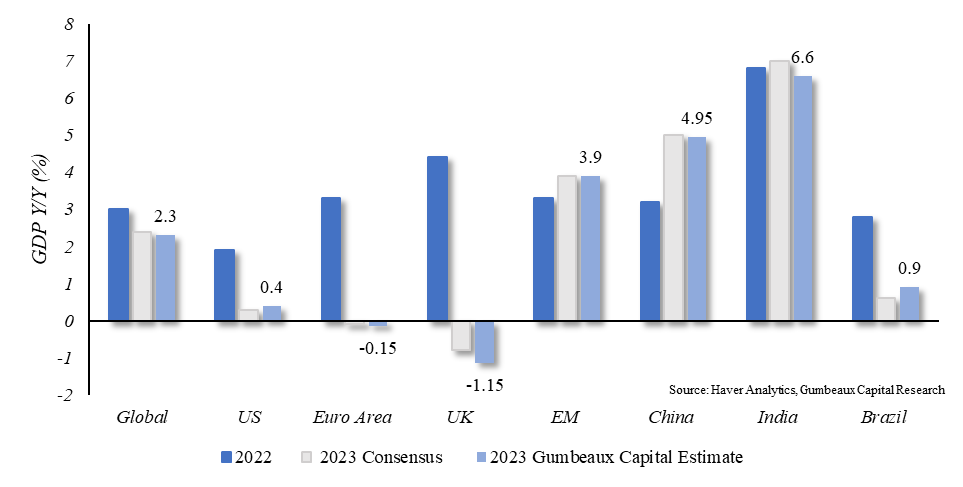
Derived from our projections of the Philips Curve, we expect global growth figures to follow in line notwithstanding any idiosyncratic risks that can be imposed on specific economies. We expect that the global economy will end 2023 with positive GDP figures albeit an impending recession in 2023. Furthermore, given the constraints of sticky inflation, tighter financial conditions, increasing reliance on total-factor productivity, and the rising cost of capital, we still estimate global growth figures to slightly underperform consensus estimates with the exception of Brazil (see Exhibit D).
Exhibit D: Albeit the signal for an impending recession, we believe it will be shallow and short-lived, allowing aggregate numbers to enter positive territory by 2023 YE.
Allocation Playbook
Despite the given macro environment signaling slower growth and further economic uncertainty, we do believe that 2023 will provide more opportunities to capture yield via tactical tilts to a strategic portfolio.
Equities
We expect that market-to-fundamentals dislocation will dissipate and will allow stock-bond correlations to normalize to their traditionally inverse correlation. Furthermore, as our evident macro-headwinds (rising cost of capital, slow real wage growth) will continue to impose pressures on valuations via compressing margins, and earnings multiples, we believe that operating leverage will be an ongoing topic at shareholder meetings as companies aim to navigate a tighter economy regardless of aggregate demand levels. Nonetheless, we do believe in a neutral (but net positive versus 2022) allocation in equities broadly speaking. We favor tactical tilts in emerging market equities over developed market equities as we expect the USD to “cool-off” from its 2022 valuations (see exhibit E & F). Particularly within emerging market equities, we favor Chinese equity exposure as China is looking to ease “COVID Zero” offering counter-cyclical yield opportunities for equity allocations.
Exhibit E: A Stronger USD performance tends to hinder yield in emerging market equities versus the S&P 500.
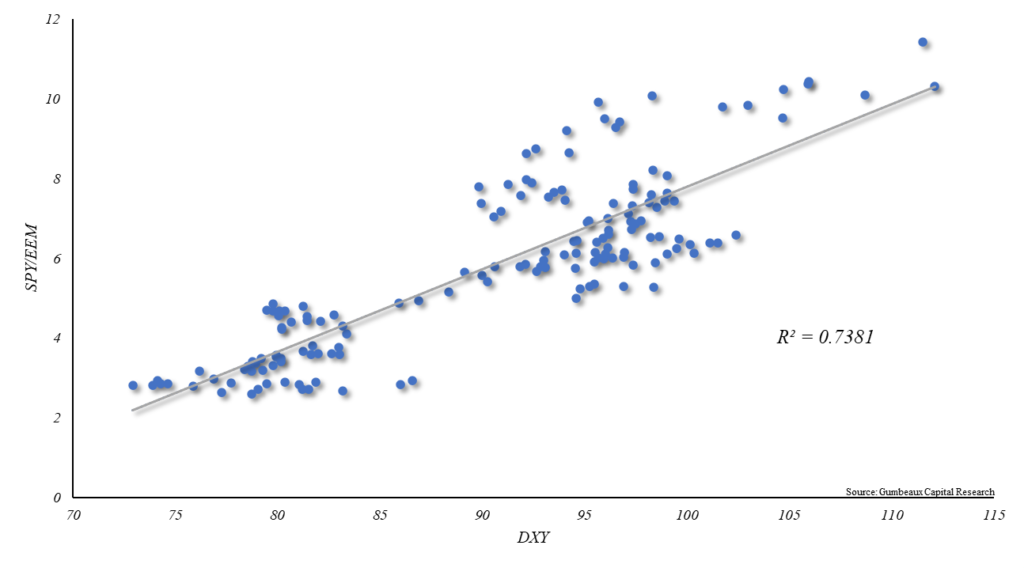
Exhibit F: When DXY is greater than or equal to 100, the pain is felt in non-US markets.
Fixed Income
Fixed income, and in particular, core fixed income has become the hot topic amongst asset managers as the macro environment is cultivating compelling yield opportunities within the asset class. Broadly speaking, the performance of fixed income will be contingent upon the performance of the US economy (given the broad exposure to US debt markets). Moreover, we expect that the US economy will experience wind-shears on its final approach, and a “bumpy” landing, and avoid an emergency allowing the market to avoid large volumes of defaults and downgrades which is of course contingent on continuous disinflation. This scenario, which we view as increasingly probable, will provide investors with exceptional risk-adjusted returns throughout 2023 across treasuries, Munis, agency MBS, structured products, and the higher end of the capital stack regarding corporates. Although, it is key to contextualize this scenario with respect towards our expectation of sticky inflation, investors may see more success with tilts towards the front end and belly of the yield curve as we believe that the back end of the curve has priced in excess levels of disinflation.
We find a similar dynamic within developed markets outside of the US as similar macro-trends are transpiring, but investors should be weary of fixed income exposure within the European region as real rates may lag behind aggregate levels while the ECB and other European Central banks may remain hawkish for longer. We remain underweight on European debt until geopolitical risks in the region are tamed, and real rates find an inflection point.
Emerging market debt provides a highly compelling opportunity set at the government level as emerging market countries were more proactive than developed market countries in monetary policy normalization. This dynamic has allowed emerging market countries to have higher, and positive real rates broadly speaking. We expect this dynamic to create elevated levels of carry on local-currency denominated bonds, and subsequently drawdown market rates creating a great environment for excess returns. We are tactically overweight EM government debt in 2023, but neutral (net positive versus 2022) on EM IG corporates, and high yield, as we do not see the broader macro environment allowing the asset classes to provide clear enough risk profiles.
From an aggregate perspective, we expect liquidity to continue to accelerate in debt markets as we expect an uptick in net issuance in lieu of monetary policy accommodation; economies will now look towards fiscal action if/when needed throughout 2023.
Commodities
We expect commodities to preform lower than they did in the early half of 2022, but recapture yield lost in the second half of 2022. We estimate that commodity futures markets have priced in too much demand compression relative to supply given the impending “re-opening” of China, and further deterioration of global linkages via geopolitical risks. We are neutral on the broader asset class given its inflation beta, but investors could see elevated risk adjusted return in precious metals as a ballast against sticky inflation, geopolitical uncertainty, and potential rate volatility.
]]>Data dependency ?
Data dependency from the Fed as a substitution for forward guidance can be highly nebulous to all, but we should revisit the econ-101 days to unpack this picture. Despite the complexities of the Federal Reserve’s framework, we must remember that the Fed is tied to its dual-mandate of maximum employment and price stability (in no particular order of course). This should imply that the Fed is closely monitoring inflation and labor statistics to guide them on their impending policy decisions.
Dive into the Data
It is highly evident that the Fed has been using its tool-kit to fight inflationary pressures as we saw a 0.3% M/M Core CPI print in July. This is a substantial landmark for a data dependency framework as a 1.4% drop in CPI from June marks as the largest M/M decline since the 1980s. Moreover on the inflation picture, the NFIB relayed that for small market enterprises (SMEs) a net 37% of SMEs plan price hikes, which is down 12 points from June. This is highly indicative of an inflection point in US inflation momentum, but we must keep in consideration the composition of decelerating inflation to grasp a clear macro-picture (see Figure 1).
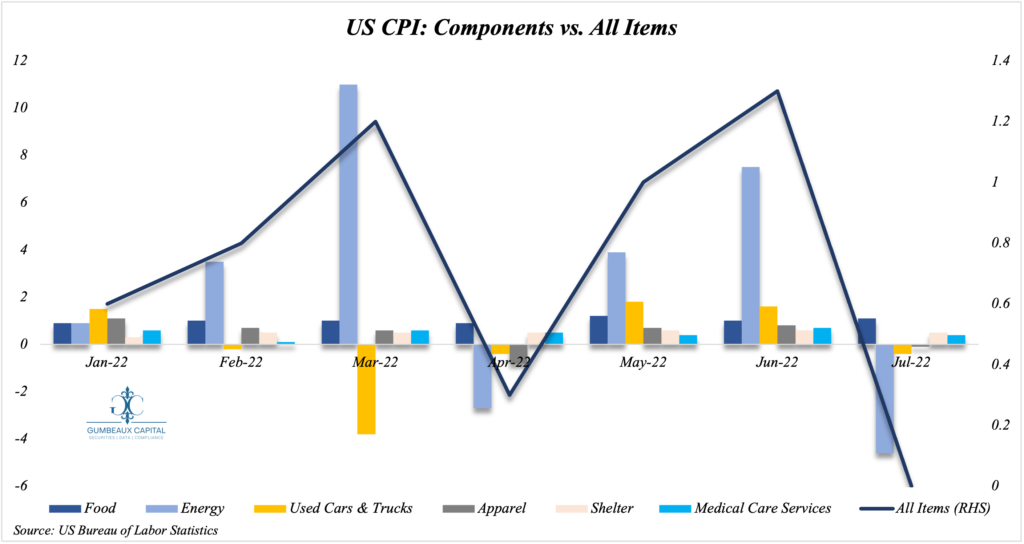
We can note that the culprits of the M/M move down in CPI is the more cyclical components such as energy (light blue), and used cars & trucks (gold). From a high level point of view, the supply chains on these components have not improved substantially from their tightest conditions, so the evidence of demand destruction is starting to build. Another dynamic to keep an eye on is the relative stickiness of inflation within components such as food and shelter, in which is further indication of the waning of the “soft-landing” narrative for the US Economy.
When we look at labor market dynamics, we have a similar picture to inflation; where we have labor market conditions peaking as well (see Figure 2).
Despite July’s NFP data coming in hot, jobless claims and JOLTS data provides a sobering picture.
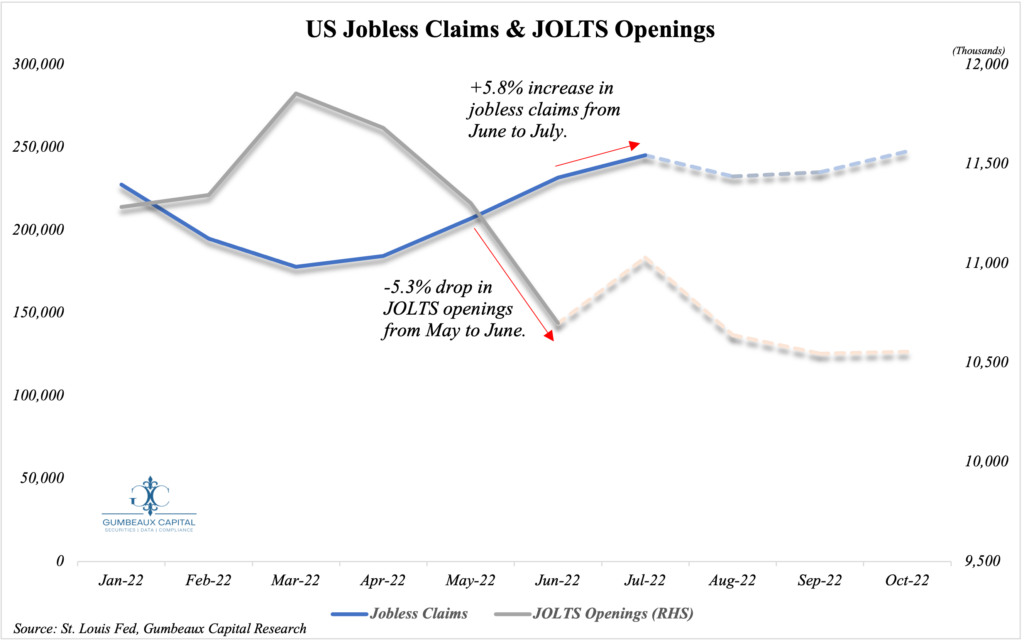
While we saw a red hot NFP data print for the month of July, the jobless claims count has been rising as we see increased levels of layoffs (highly-evident in tech) as cost of capital continues to rise for firms. JOLTS data paints the same picture as we have seen a consistent drop in job openings since February. We project that jobless claims will initially fall in July due to the relatively improved business conditions seen in July, allowing for more job openings, but the picture will continue to extrapolate the macro environment with slightly lower job openings and increased jobless claims; especially as the labor-force-participation-rate remains below pre-pandemic levels.
Nonetheless, with promising inflation trends, but sobering underlying data with labor markets, the Fed has its work cut out for them. Going forward on a data dependency framework in this particular macro-environment practically forces the Fed to now chose whether to (mainly) focus on reducing price pressures, or to maintain employment levels. The question going forward is; which does the Fed see as the largest threat to the economy? Judging from the recent talking points from this year’s FOMC meetings, one can move with conviction that the Fed will continue to focus on fighting inflation unequivocally.
Bracing for a rough landing
Assuming that we will continue our inflation data trajectory, and continue to get a price-stability-oriented Fed, we can extrapolate that we may see a case to where the Fed may not have to be as aggressive versus the picture we saw in June (see Figure 3).
The OIS Curve is pricing in 3 fewer hikes in 2023 following July’s FOMC meeting.
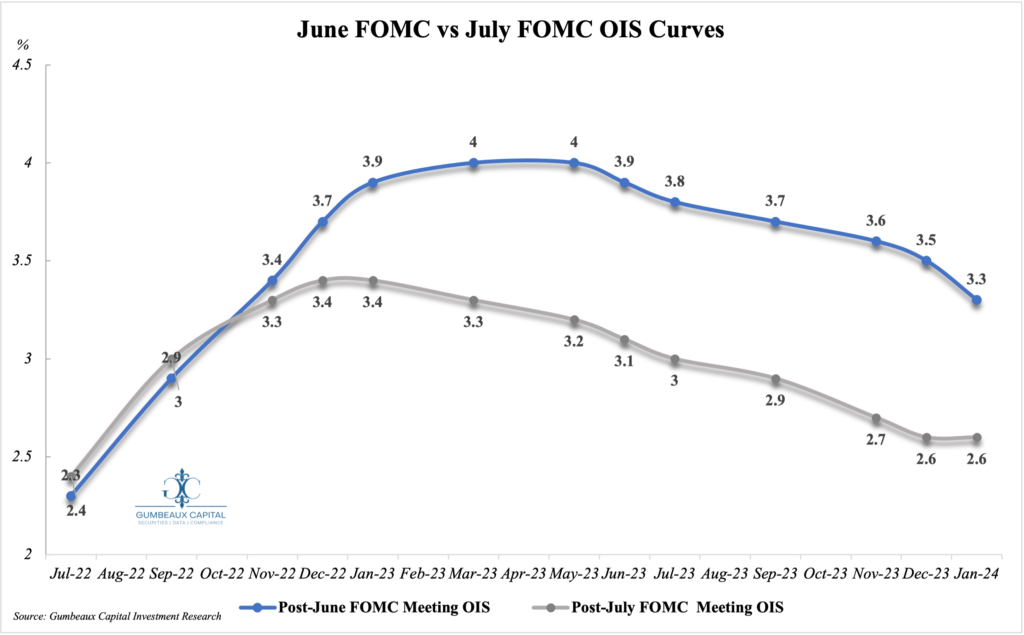
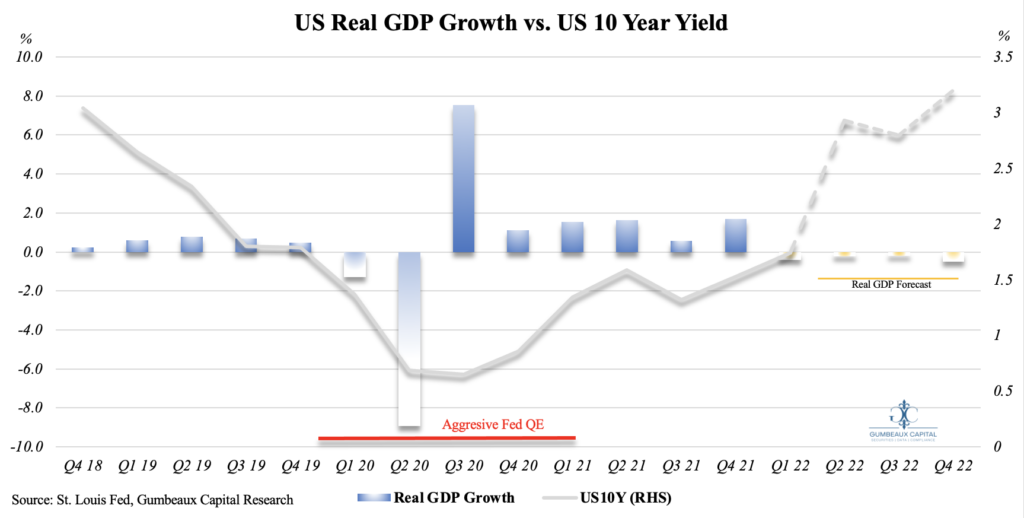
We must keep in mind that a scenario where the Fed prevails victorious in its fight against inflation may not be the sole catalyst to a less aggressive (forward-looking) Fed. The Fed may have to become more accommodative to the economy as the prospects for a “rougher than expected landing” continue to grow (see Figure 4, 5, & 6).
We have forecasted Real GDP Growth to slow substantially into further negative territory (-0.5%) over the remainder of 2022 based on our readings of the labor market, the 2s/10s curve, and the FFR/10s curve.
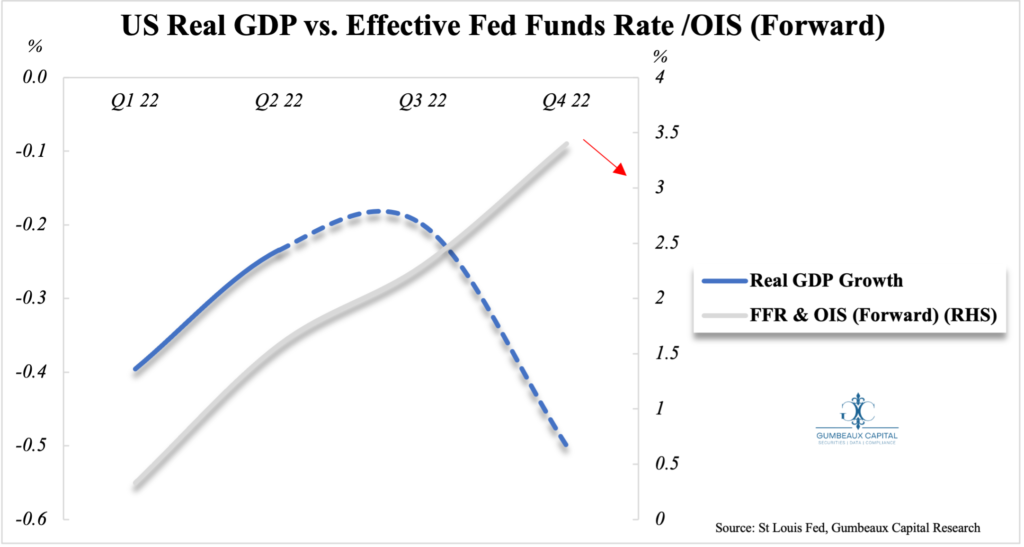
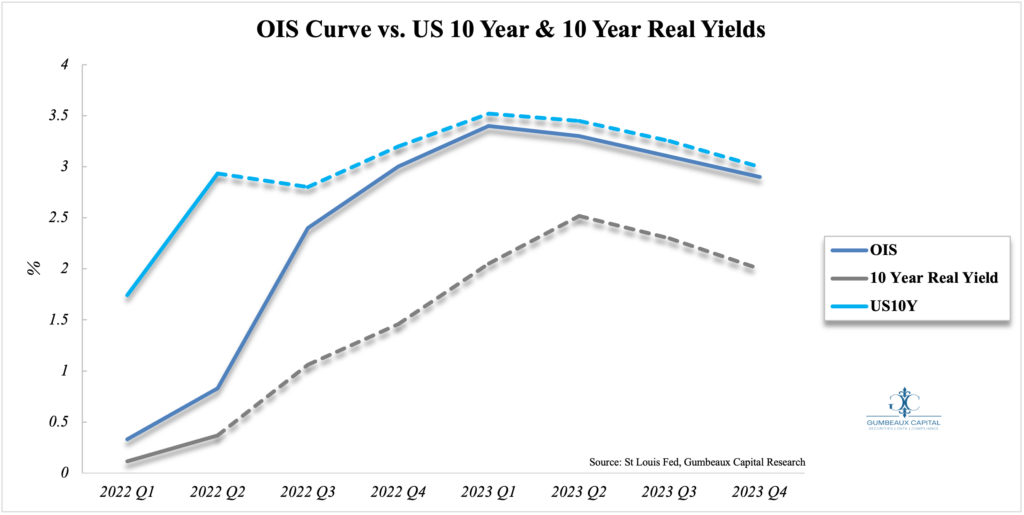
These forecasted dynamics have presented prospects of a rise, and then subsequent fall in 10 year nominal and real yields over the next 16 months as per our forecast.
When putting our growth forecasts into context with 10 year yields, we can exogenously extrapolate that we could expect real GDP growth to resume in H1 2023.
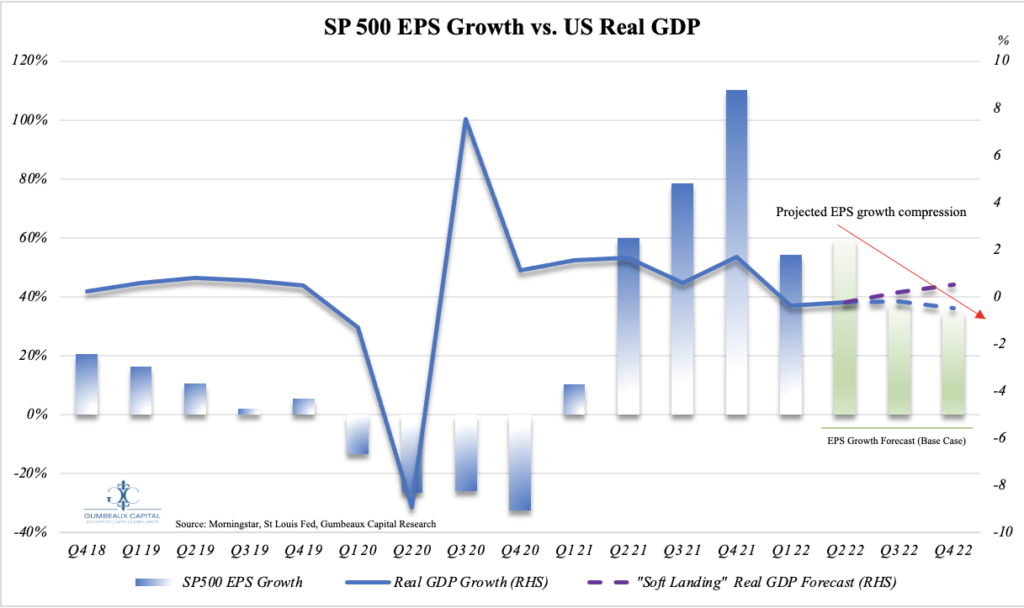
The given data has given a compelling feel for fixed income going forward vs equities. Though Q2 earnings has been relatively upbeat, which is a certain catalyst for the recent market rally, we do not expect EPS growth to continue strengthening from a broad basis; even in a goldilocks “soft landing” scenario (see Figure 7).
We forecast a 41.44% compression in S&P 500 EPS growth through the end of the 2022 (9.2% annual growth rate) regardless of growth scenarios.
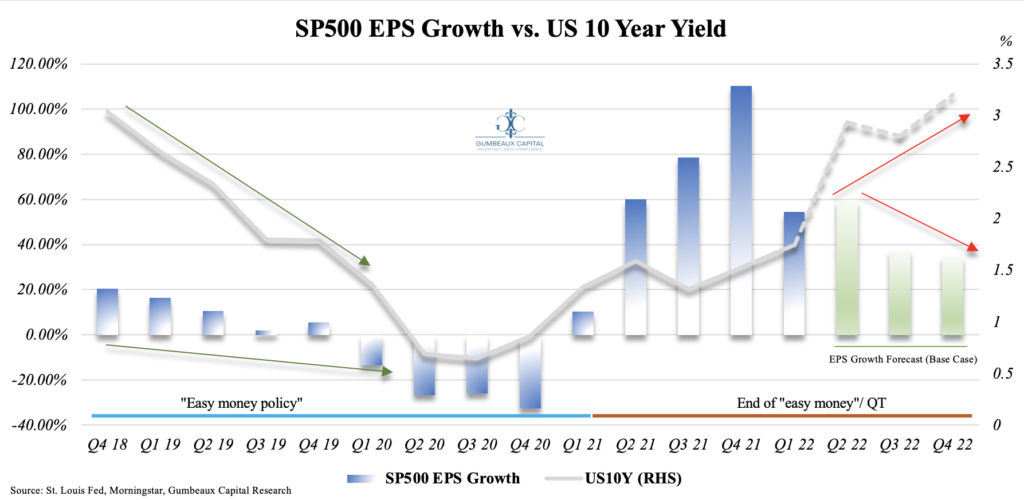
As the Fed continues to reduce its balance sheet, expect to see divergence from previous trends of lower yields amidst economic uncertainty. This is indicative that investors should utilize bonds as a risk ballast, and a supplementary yield enhancer in their portfolios in the event we begin to see consistent reduction in inflation (see Figure 8).
The given environment provides us with conviction that bonds will unchain themselves from relatively high correlations with equity performance going into H1 2023.
Rough landing playbook
Our forecasts are not to say that equities have an outright pessimistic outlook going into the latter half of H2 2022 and H1 2023, as we saw very few proponents for equities going into H12022. Yes, financial conditions are getting tighter amidst a broad based rise in cost of capital and slight demand destruction, but it is key to note that the US is still in a position to outperform the rest of the world in terms of earnings growth. This will certainly maintain ample levels of inflows into US capital markets. Equities are positioned to simply take another “breather”, although high quality (healthy margins, high operating leverage, and warrantable valuations etc. ) equities can see excess yield within this environment. All-in-all a move higher in the capital structure and a tactical tilt towards government bonds (2s/10s flatteners) may provide great risk-adjusted opportunities for investors.
]]>We attribute this performance in commodities (.. or inflation to be frank) to the financial market illiquidity that has perpetuated supply chain constraints despite the classical assumption that tighter financial conditions yield an “easing” effect on supply chains via demand reduction contrary to the popular belief that US inflation is demand driven. For context, real consumer spending has grown 2.6% per annum since the pandemic, in which the pre- pandemic levels saw a 2.4% growth rate (2 years leading).
Deep dive into the Components
When we look at CPI composition it is no mystery that energy was by far the largest contribution to the 8.3% YTD print for April 2022 with the energy index rising 30.3 percent over the past 12 months, the gasoline index increasing 43.6 percent, the fuel oil index rising 80.5 percent, and the index for natural gas increasing 22.7 percent over the last 12 months (04/21-04/22). Where supply-side constraints have been levied by historically low E&P CapEx in the sector, oil and gas firms have been “running on fumes” from an inventory standpoint as well as the sector from an aggregated standpoint. Even though inventory turnover has been generally well in this environment, many firms would like to take advantage of the current prices (given that consumers buy at spot prices), and the only way to increase supply sources in a timely manner is to embark on an aggressive increase in E&P CapEx (I.e., Venture Global’s $3.4 billion Plaquemines LNG Project). This only is done at the opportunity cost of taking advantage of the recent remarkable equity outperformance via capital restructuring in aim to add perpetuity to free-cash-flow yields; in which could create a goldilocks environment for oil and gas investors as this could prolong market price trends and prove as a hedge for firms against the 1m/6m spread in oil futures sitting at around $24/bbl (which indicates that oil futures are pricing in our initial scenario of increased CapEx, and or potential demand destruction).
Agricultural goods have been no different from energy as the food at home index rose 10.8 percent over the last 12 months, which is the largest 12-month increase since the period ending November 1980. The index for meats, poultry, fish, and eggs increased 14.3 percent over the last year, the largest 12-month increase since the period ending May 1979. The other major grocery store food group indexes also rose over the past year, with increases ranging from 7.8 percent (fruits and vegetables) to 11.0 percent (other food at home).
It is key to notice the spread on corn to contextualize the supply-side of agriculture as corn poses as the largest input good for agricultural products. The 1m/6m spread is right at $37; thus indicating a similar dynamic that we see in the energy markets in respects to the approach to the supply-side woes, with some endogenous factors such as variable costs associated with logistics and feed consumption.
Notable Headwinds
As rational as the hypothetical solutions to the commodity supply-side constraints may be, there are significant headwinds that will challenge firms and the aggregate economy. As briefly mentioned before, the supply side can only experience substantial growth via capital structure mechanisms (debt or equity financing), but liquidity (volume) is inextricably low in these markets.
Debt markets
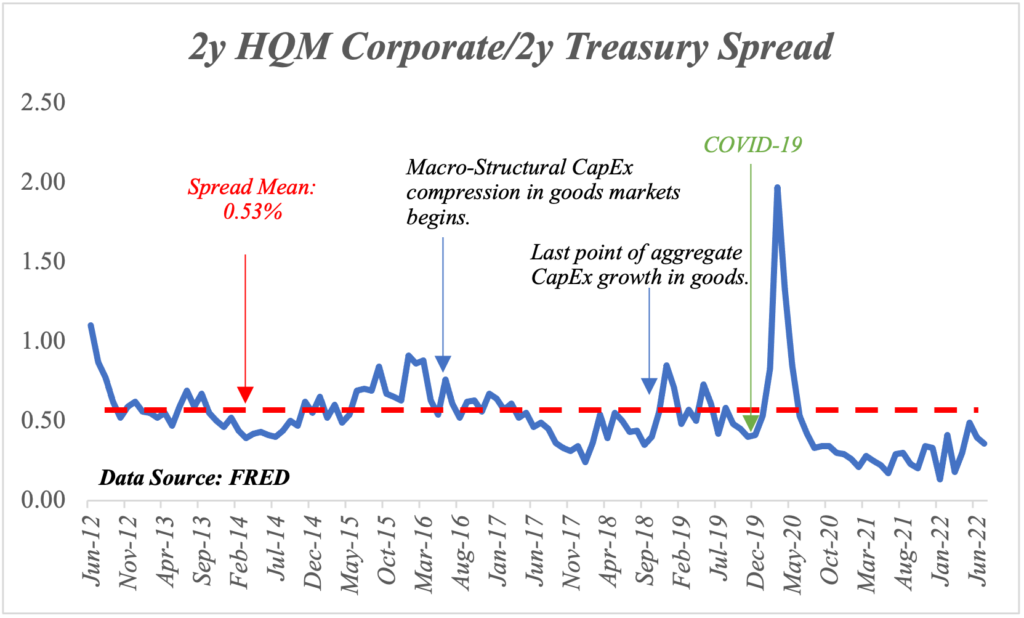
Open interest in the 2y treasury market is down 4.32% in the past year, and with 2- year high-quality corporate bond/2-year treasury bond spreads at extremely tight levels (see Figure 1), investors don’t have the risk premium that they usually do to position themselves in corporate bonds. Pairing this dynamic with the low liquidity in the comparable treasury market, it is safe to extrapolate that intermediate -term funding facility utility will continue to shrink for corporates.
Equity markets
Equity Markets follow a slightly similar trend as debt markets, but with an ever so slightly more upbeat tone. Equity market trading volume is up 43% YTD (composition of Dow Jones, SP500, and NASDAQ indexes). Equity issuance is down 79.5% Y/Y which can be attributed by fee expansion from intermediaries passing down increased variable, and operating costs on their clients (corporates).
This dynamic may constrain and de-incentivize firms to leverage equity financing for needed expansion, and in-turn may perpetuate supply-side constraints on the economy.
Economic “Hurricane” ?
With the given assessments made, all extrapolations lead to higher price levels throughout H2 2022, but as we all know the Federal Reserve remains committed to reducing inflation, and it is always safe to assume that in the midst of an election year, policymakers will be ultra-incentivized to combat inflation as well. This ultimately points us to the outcome that demand destruction will be required to alleviate price pressures regardless of how much of a culprit consumers are relative to the supply-side; this is ultimately a recipe for substantial pressures on the broad economy, and possibly akin to the “economic hurricane” JP Morgan’s CEO Jamie Dimon discussed.
Overall growth is at risk to underperform consensus growth for the next year, and the notion that we are in the later portion of the economic cycle is well confirmed. Recession or not, the US economy is heading for turbulence, albeit its remarkable performance vs. the rest of the world post-pandemic.
]]>Russia-Ukraine Conflict
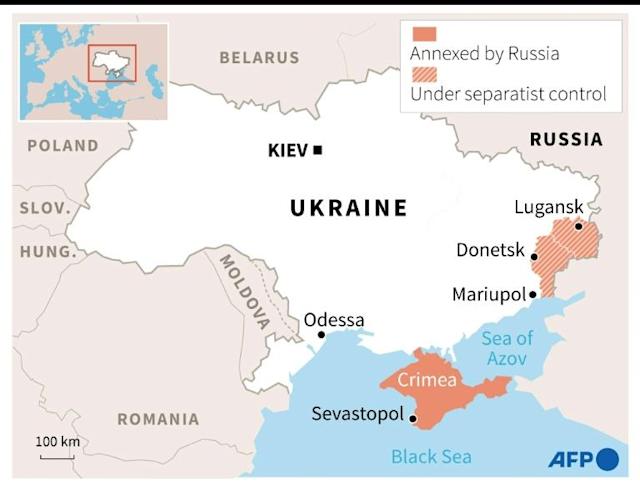
Serving as the “elephant in the room” the Russia-Ukraine conflict has served as the main source of volatility in 1Q2022. In October of 2021, many reports transpired that contingents of Russian troops and military hardware were being moved to the Russian-Ukrainian border. These reports came in tandem with reports that Russia had already inhibited access to 2/3rds of the Azov sea which borders the Russian-annexed Crimean Peninsula to the north. Now, as of 02/22/2022, Vladimir Putin has executed a decree that recognizes the separatist regions of Ukraine (Donetsk and Luhansk) following a Russian Security Council meeting held on 02/21/2022 [See figure 1].
These events were shortly followed by a statement made by Ursula von der Leyen, “The recognition of the two separatist territories in Ukraine is a blatant violation of international law, the territorial integrity of Ukraine and the Minsk agreements. The EU and its partners will react with unity, firmness and with determination in solidarity with Ukraine.” This comment from the President of the EU Commission accentuates the EU’s disposition on the Russian initiatives which is ultimately based on the geopolitical position of NATO.
Pre Invasion
With concerns from NATO, many expect there to be sanctions formulated against Russia contingent on an “unlawful” encroachment of the Ukrainian territories. This disposition can also be seen as US Secretary of State Anthony Blinken expressed, “We’ve been clear if any Russian military forces move across Ukraine’s border, that’s a renewed invasion. It will be met with swift, severe and a united response from the United States and our partners and allies.” It is also key to contextualize the developments from the UN security council meeting held on 02/21/2022. The UNSC meeting carried some mixed assessments as various nations made many statements agin to the Russian initiatives such as: US Ambassador and Permanent Representative to the UN, Linda-Thomas Greenfield expressing, ” This is nonsense, we know what they really are.” Greenfield even went to the lengths of accusing Russia of creating “a pretext of war.” Kenyan Ambassador and Permanent Representative to the UN, Martin Kimani stated, “It has been assaulted, as it has been by other powerful states in the recent past. We call on all member states to stand behind the Secretary-General in asking him to rally us to the standard of defending multilateralism. We also call on him [Putin] to bring his [Putin] good offices to bear to help the concerned parties resolve the situation by peaceful means.” These invasion-adverse statements were mostly made akin by (mostly western) other nations. These statements were then variegated by the likes of China and India as China’s Permanent Representative to the UN Zhang Jun, expressed, “[global delegates] should continue dialogue and consultation and seek reasonable solutions,” and “All parties concerned must exercise restraint, and avoid any action that may fuel tensions,” and to “welcome and encourage every effort for a diplomatic solution.” India’s Permanent Representative to the UN, T.S. Tirumurti expressed a similar sentiment to China’s Zhang Jun as he stated, “[RU-UKR conflict] can only be resolved through diplomatic dialogue”, and said: “We need to give space to the recent initiatives undertaken by parties which seek to diffuse tensions.”
Russian Sanction Playbook (Pre Invasion)
While the proposition of further sanctions against Russia are certainly evident due to the now onset (and growing) invasion of Ukraine, it is key to contextualize the pre-invasion sanctions imposed on Russia to understand the perpetual dynamics of what the post-invasion sanctions will be.
EU Sanctions (Pre Invasion)
Sanctions from the EU remained relatively light following Putin’s decision to recognize Ukraine’s separatist territories. Sanctions were imposed on all members of the lower house of the Russian parliament who voted in favor of the recognition of the breakaway regions, freezing any assets they have in the EU and banning them from traveling to the EU. EU sanctions also included import bans on goods from the non-government controlled areas of the Donetsk and Luhansk oblasts; prohibition to finance the Russian Federation, its government and Central Bank via restraining the ability of the Russian state and government to access the EU’s capital and financial markets and services were also a component of EU sanctions.
US Sanctions (Pre Invasion)
Joe Biden’s “first tranche” of sanctions included sanctions on two of Russia’s state-owned banks – VEB and Promsvyazbank – and blocked Russia from trading in its debt on US and European markets along with similar sanctions on members of the lower house of the Russian parliament who voted in favor of the recognition of the breakaway regions. The US has also committed to sanctions against NordStream2 AG (parent company of the NordStream2 project).
UK Sanctions (Pre Invasion)
UK sanctions included sanctions against Rossiya Bank, IS Bank, General Bank, Promsvyazbank and Black Sea Bank. The UK will also join the EU and US by prohibiting sovereign debt issuance in the UK. The UK is also sanctioning 3 Russian billionaires that hold positions in the oil & gas industry and finance industry.
german sanctions (pre Invasion)
Even though Germany is a Core EU nation, German “sanctions” came in an unorthodox fashion. In addition to the umbrella of EU sanctions, German Chancellor Olaf Scholz announced the halting of plans to execute Gazprom’s (Russian oil firm) $11.6 billion project “NordStream2”. The project was intended as a 1,230 kilometer pipeline that would supply 151 million cubic meters of natural gas per day.
Japan Sanctions (pre Invasion)
Japan’s sanctions included banning issuance of Russian bonds in Japan as well as restricting travel to Japan for select Russian individuals.
Invasion Launch
It is ever so evident that despite the aggressive and highly-concerned undertones expressed in the UN Security Council meeting on 02/21/2022, the sanctions imposed against Russia have been relatively light in contrast, but now that we have now endured what many global leaders feared would happen… a Russian invasion of Ukraine, we have seen an additional layer of sanctions added to the Russian economy.
EU Sanction Playbook
Extended EU sanctions against Russia will increase the number of Russian banks blocked from EU financing. Bank Otkritie, Alfa-Bank, and various lending organizations have been added to the financial blacklist for the EU in addition to the pre-invasion sanctions as-well as Russians being limited to depositing no more than 100,000 euros in EU banks.
Russian aerospace and defense companies were also sanctioned by the EU with securities transaction and lending restrictions imposed on the heavily state-owned sector. Export limitations on goods that serve as benefit to the Russian military such as, but not limited to, sensors, telecommunication hardware, and lasers have been imposed as-well.
US Sanction Playbook
The US has imposed very meticulous financial sanctions on Russian financial institutions. As per the US Treasury, “Treasury is taking unprecedented action against Russia’s two largest financial institutions, Public Joint Stock Company Sberbank of Russia (Sberbank)and VTB Bank Public Joint Stock Company (VTB Bank), drastically altering their fundamental ability to operate. On a daily basis, Russian financial institutions conduct about $46 billion worth of foreign exchange transactions globally, 80 percent of which are in U.S. dollars. The vast majority of those transactions will now be disrupted. By cutting off Russia’s two largest banks — which combined make up more than half of the total banking system in Russia by asset value — from processing payments through the U.S. financial system. The Russian financial institutions subject to today’s action can no longer benefit from the remarkable reach, efficiency, and security of the U.S. financial system. The US Treasury also disclosed sanctions, “on three additional major Russian financial institutions: Otkritie, Novikom, and Sovcom. These three financial institutions play significant roles in the Russian economy, holding combined assets worth $80 billion. These designations further restrict the Russian financial services sector and greatly diminish the ability of other critical Russian economic sectors from accessing global markets, attracting investment, and utilizing the U.S. dollar.”
The US has also decided to pursue sanctions against Russian individuals.
Japanese Sanction Playbook
Japan has also targeted Russia’s financial sector by imposing sanctions on Promsvyazbank, Bank Rossiya and Russia’s economic development bank VEB.
Japan has also avoided targeting Russia’s energy exports in their second set of sanctions.
Overview of Imposed sanctions
There has also been more participants such as South Korea, and the UK who have imposed sanctions on Russia; carrying parallels to the US, EU, and Japan. Global sanctions on Russia’s energy exports have been absent.
Collateral Damage
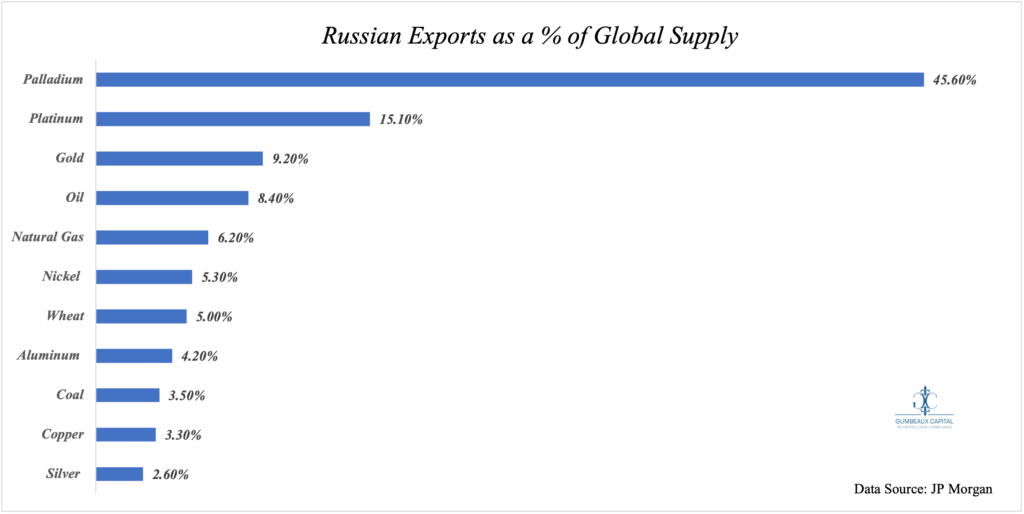
A large question at hand following the sanctions that have been imposed on Russia’s economy is if the economic risk will be felt not only in Russia, but if the effects will felt by its economic partners and adversaries? First we must take a look [Figure 2] at who Russia’s largest trading partners are and what Russia exports to the world in abundance amidst a global goods supply “struggle” [Figure 3]:
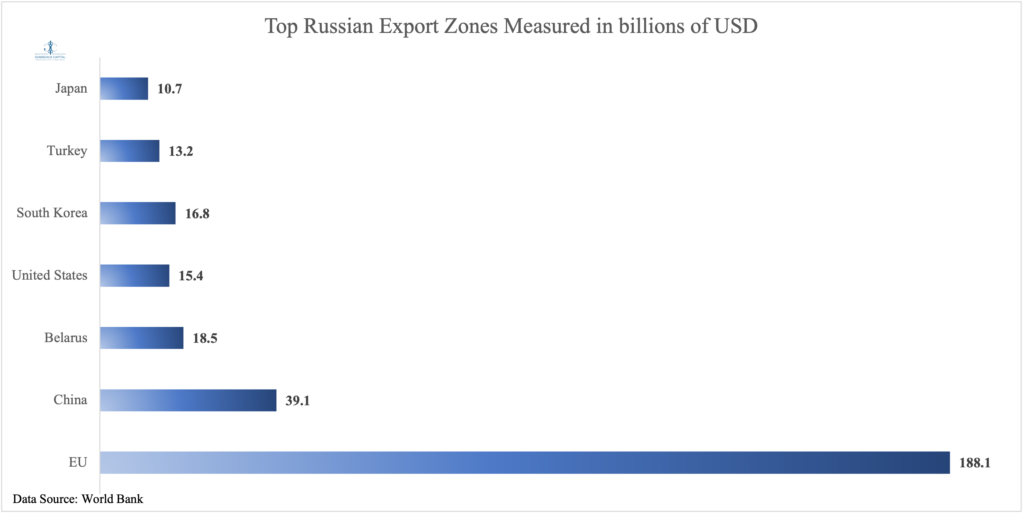
EU Dynamics
The EU has been dealing with a debilitating energy crisis preceding the Russian invasion of Ukraine, and given that the largest composition of goods imported from Russia fall under the energy basket (at 63% of all EU imports from Russia as of 2020), we can note that this was a catalyst of leaving out energy sanctions. This was extrapolated as Brent Crude exceeded $100 on the fears of sanctions against Russian energy exports.
The financial sanctions imposed against Russia from the EU in tandem with the US has led to the 45% decline in the MOEX index, and Russian 5-year credit default swap spiking approximately 178% from the start of 2022.
Chinese Dynamics
It is well known that China and Russia carry a close, but uncanny relationship with China. The Russia-China relationship has undoubtedly grown closer due to what both countries see as a relationship of “convenience” to strategically counter the feeling of a western-derived “existential threat” against their existing authoritarian regimes; in particular, the US’ “hegemonic power”
Bounded in particular by the notion that Moscow understands it cannot resist the US’ hostile economic and political stance against it without the economic leverage from Beijing; correspondingly Beijing understands that Russia provides value in its relative advantage in military technology. As quoted from the OSW’s Beijing-Moscow Axis, “This is the area of greatest differences between the partners, in which they can even openly compete with each other as they pursue their own individual interests. However, this happens largely without damaging the integrity of their relations. Central Asia occupies a special place in their relationship, since it is the immediate strategic hinterland for both. Therefore, even though the region is the object of their competition, they coordinate their actions here to a greater extent than anywhere else (see Part V). Chinese experts believe that the Russian Federation only pursues an active policy in those parts of the world where it can use its only asset i.e. military power. Since Beijing prefers a strategy based on economic expansion, the partners can pursue complementary activities, as was the case with the 2019 crisis in Venezuela. In some cases, Russian security involvement is concurrent with the PRC’s economic interests, as in the Central African Republic: although from the point of view of the CCP elite, the line between Moscow offering its ‘security services’ in the Third World and deliberately creating a demand for it is blurred.”
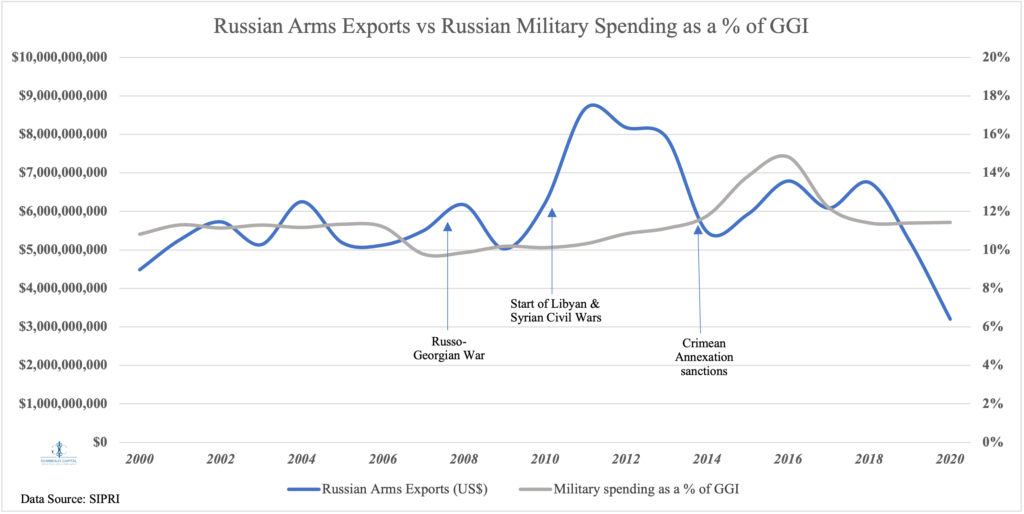
Provided the pretext on Russia’s military based advantage, we should take a look at the true value in its economic context: As SIPRI reported,” Russian arms exports in 2016–20 were at a similar level to 2001–2005 and 2006–10 but were 22 per cent lower than in 2011–15, when Russian arms exports peaked. While Russian arms exports in 2016–18 remained at a relatively high level, they fell in both 2019 and 2020. The overall decrease in Russia’s arms exports between 2011–15 and 2016–20 was almost entirely attributable to a 53 per cent drop in its arms exports to India. This decrease was not offset by large increases in Russia’s arms exports to China (49 per cent),” we can note that China has become a “baseline buyer” [as expected] for the Russian arms exports. This has kept Russian defense companies active despite Russian defense military spending as a % of GGI stabilizing (with some [Crimean Annexation + Sanctions] exceptions) between 10-12% (See Figure 4).
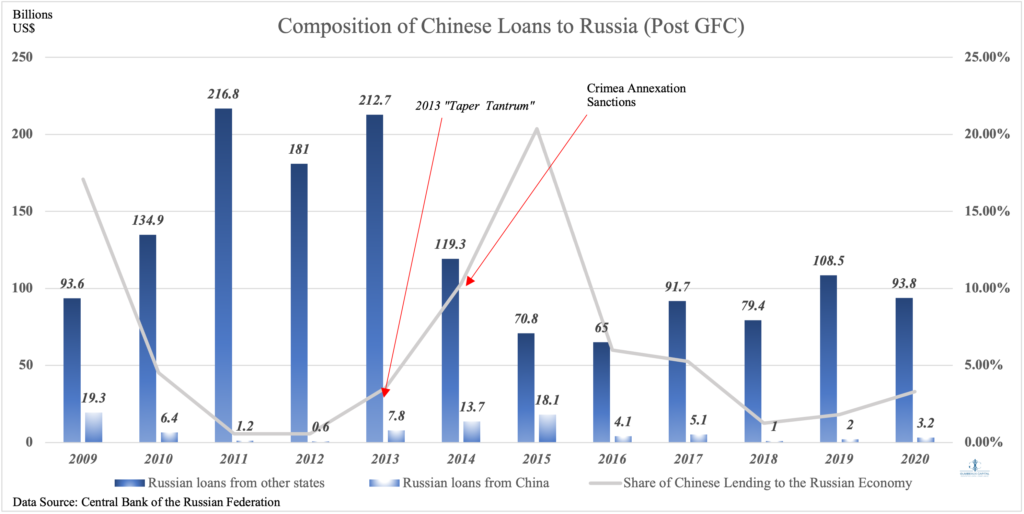
China has also, reluctantly, been a pseudo-strong supporter to the Russian financial sector. As per the OSW Beijing-Moscow Axis Report,”Financial cooperation, including Chinese loans and direct investments in Russia, is generally limited and confined to selected sectors of the economy. The way Chinese capital is utilised deepens the model of centre‐periphery relations, where raw materials from the Russian Federation are exchanged for industrial goods from the PRC. Money flows predominantly towards strategic energy and mining projects carried out by policy banks and state‐owned companies. A more ‘organic’ and commercially‐led inflow of Chinese capital from commercial banks and private investors – a potential alternative to Western funding – has encountered significant barriers: Beijing’s fear of being targeted by Western sanctions, an unfriendly business environment in Russia, and also its reluctance to sell key assets. As a result, Chinese money still has not filled the visible gap left by EU and US investors and lenders in the Russian Federation since 2014.” These dynamics are heavily extrapolated [Figure 5] as it is evident that Chinese liquidity is heavily utilized in risk events affecting Russia’s financial system in terms of inflows. Taking this dynamic into account, we can certainly expect China to do the same for Russia following the most recent western sanctions.
Albeit China serving as the liquidity “haven” for Russian risk-on events, China is still facing their own liquidity issues that could pose as detrimental over time to the existing mechanisms put in place to mitigate risk for their psuedo-ally. This overlying sentiment of risk has also bolstered the exorbitant jump in Russia’s 5-year CDS.
Belarusian Dynamics
Facing the brunt of collateral sanctions for expressing support of Russia’s invasion of Ukraine, Belarus will likely remain unfazed at the macro-level following the Russian sanctions. Unsurprisingly, Russia’s main export to Belarus is energy products and equipment which has avoided sanctions from the west. The main effect regarding this bilateral trade partnership will be financial liquidity shortages due to banking sanctions from the west.
US Dynamics
The US has taken a very similar approach to the EU with sanctions against Russia by limiting their risk against the structural oil & gas supply constraints via avoiding sanctions against Russia’s energy and petroleum exports. The US has also contributed to the impending financial liquidity crisis in Russia [Russian 5-yr CDS]. It is also key to note that the US is significantly less reliant on Russia for its oil and gas supply relative to the EU, and has many supply-side hedges against the political risks associated with the current environment within US-Russian relations; such as, but not limited to, SPR releases.
What does this mean for russia?
While it is ever so tempting for many to speculate politically, we will leave that up to the policymakers, but economically and financially Russia will see very limited effects of sanctions and its own invasion in the short-term as their energy exports and natural resources still provide ample economic value to the world, and inherently its domestic economy [See Figure 6].
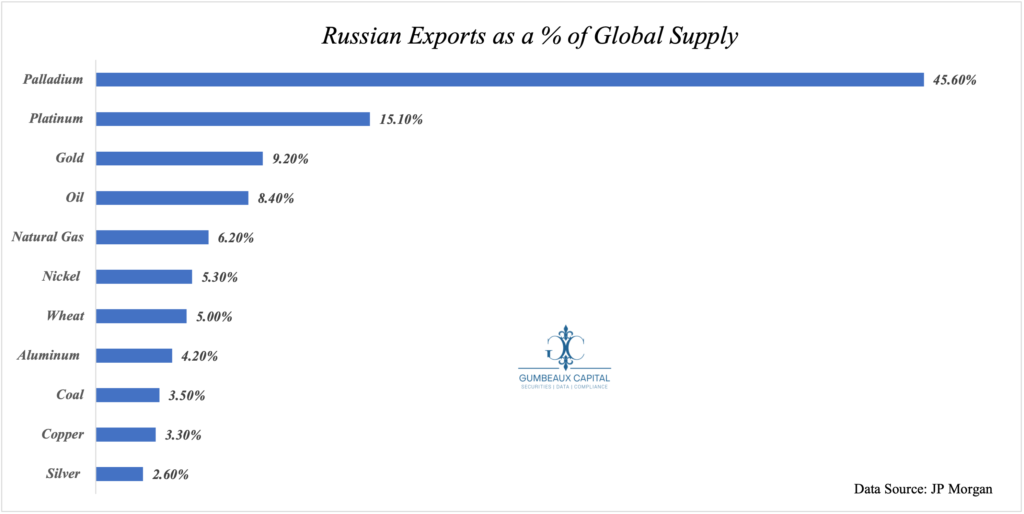
It is also key to note that if Russia is successful in their efforts to encompass Ukraine for economic leverage, Russia may have sovereign control of the resource rich Ukraine containing an ample supply of goods such as, but not limited to: Barley, Wheat, Corn, Natural Gas, Coal, Lithium, and increased strategic access to the Sea of Azov.
The marginal benefit for Russia may be dwindling due to hyper-complex political dynamics, and investor sentiment has reflected so as the mentioned move in Russian 5-Year CDS’ and the all-time low move in the Russian Ruble in FX markets.
Wrap-Up
As any military conflict would carry volatility, the Russian invasion of Ukraine has certainly created a perfect storm for volatility. Equity markets will likely extrapolate and perpetuate the dynamics we expressed in our 2022 macro outlook. FX markets will experience increased volatility due to effects of forward expectations in interest rate parity; in particular, the notion that the Russian invasion may perpetuate the European energy crisis, and may deter the ECB from their impending normalization policy. We should also expect further easing in the Chinese economy as they will likely set up liquidity-providing mechanisms for Russia as-well as their own domestic needs. This will increase the risk sentiment surrounding Emerging market growth as these events will certainly continue to make the global aggregate growth picture slightly dimmer. In due time, “safe havens” will be the dominant force in financial markets.
In the longer term perspective, keying on assets that serve as substructures of more-efficient supply chains (i.e., logistics, transportation, procurement etc.) will be critical. Energy equities with high 2021-early 2022 CapEx [as we briefly mentioned here], and or, strong and consistent free cash flow starting Q2 2021 will serve as great opportunities to capitalize off the existing and potentially lingering dynamics within the global energy sector.
]]>
“Taper Tantrum” Flashbacks
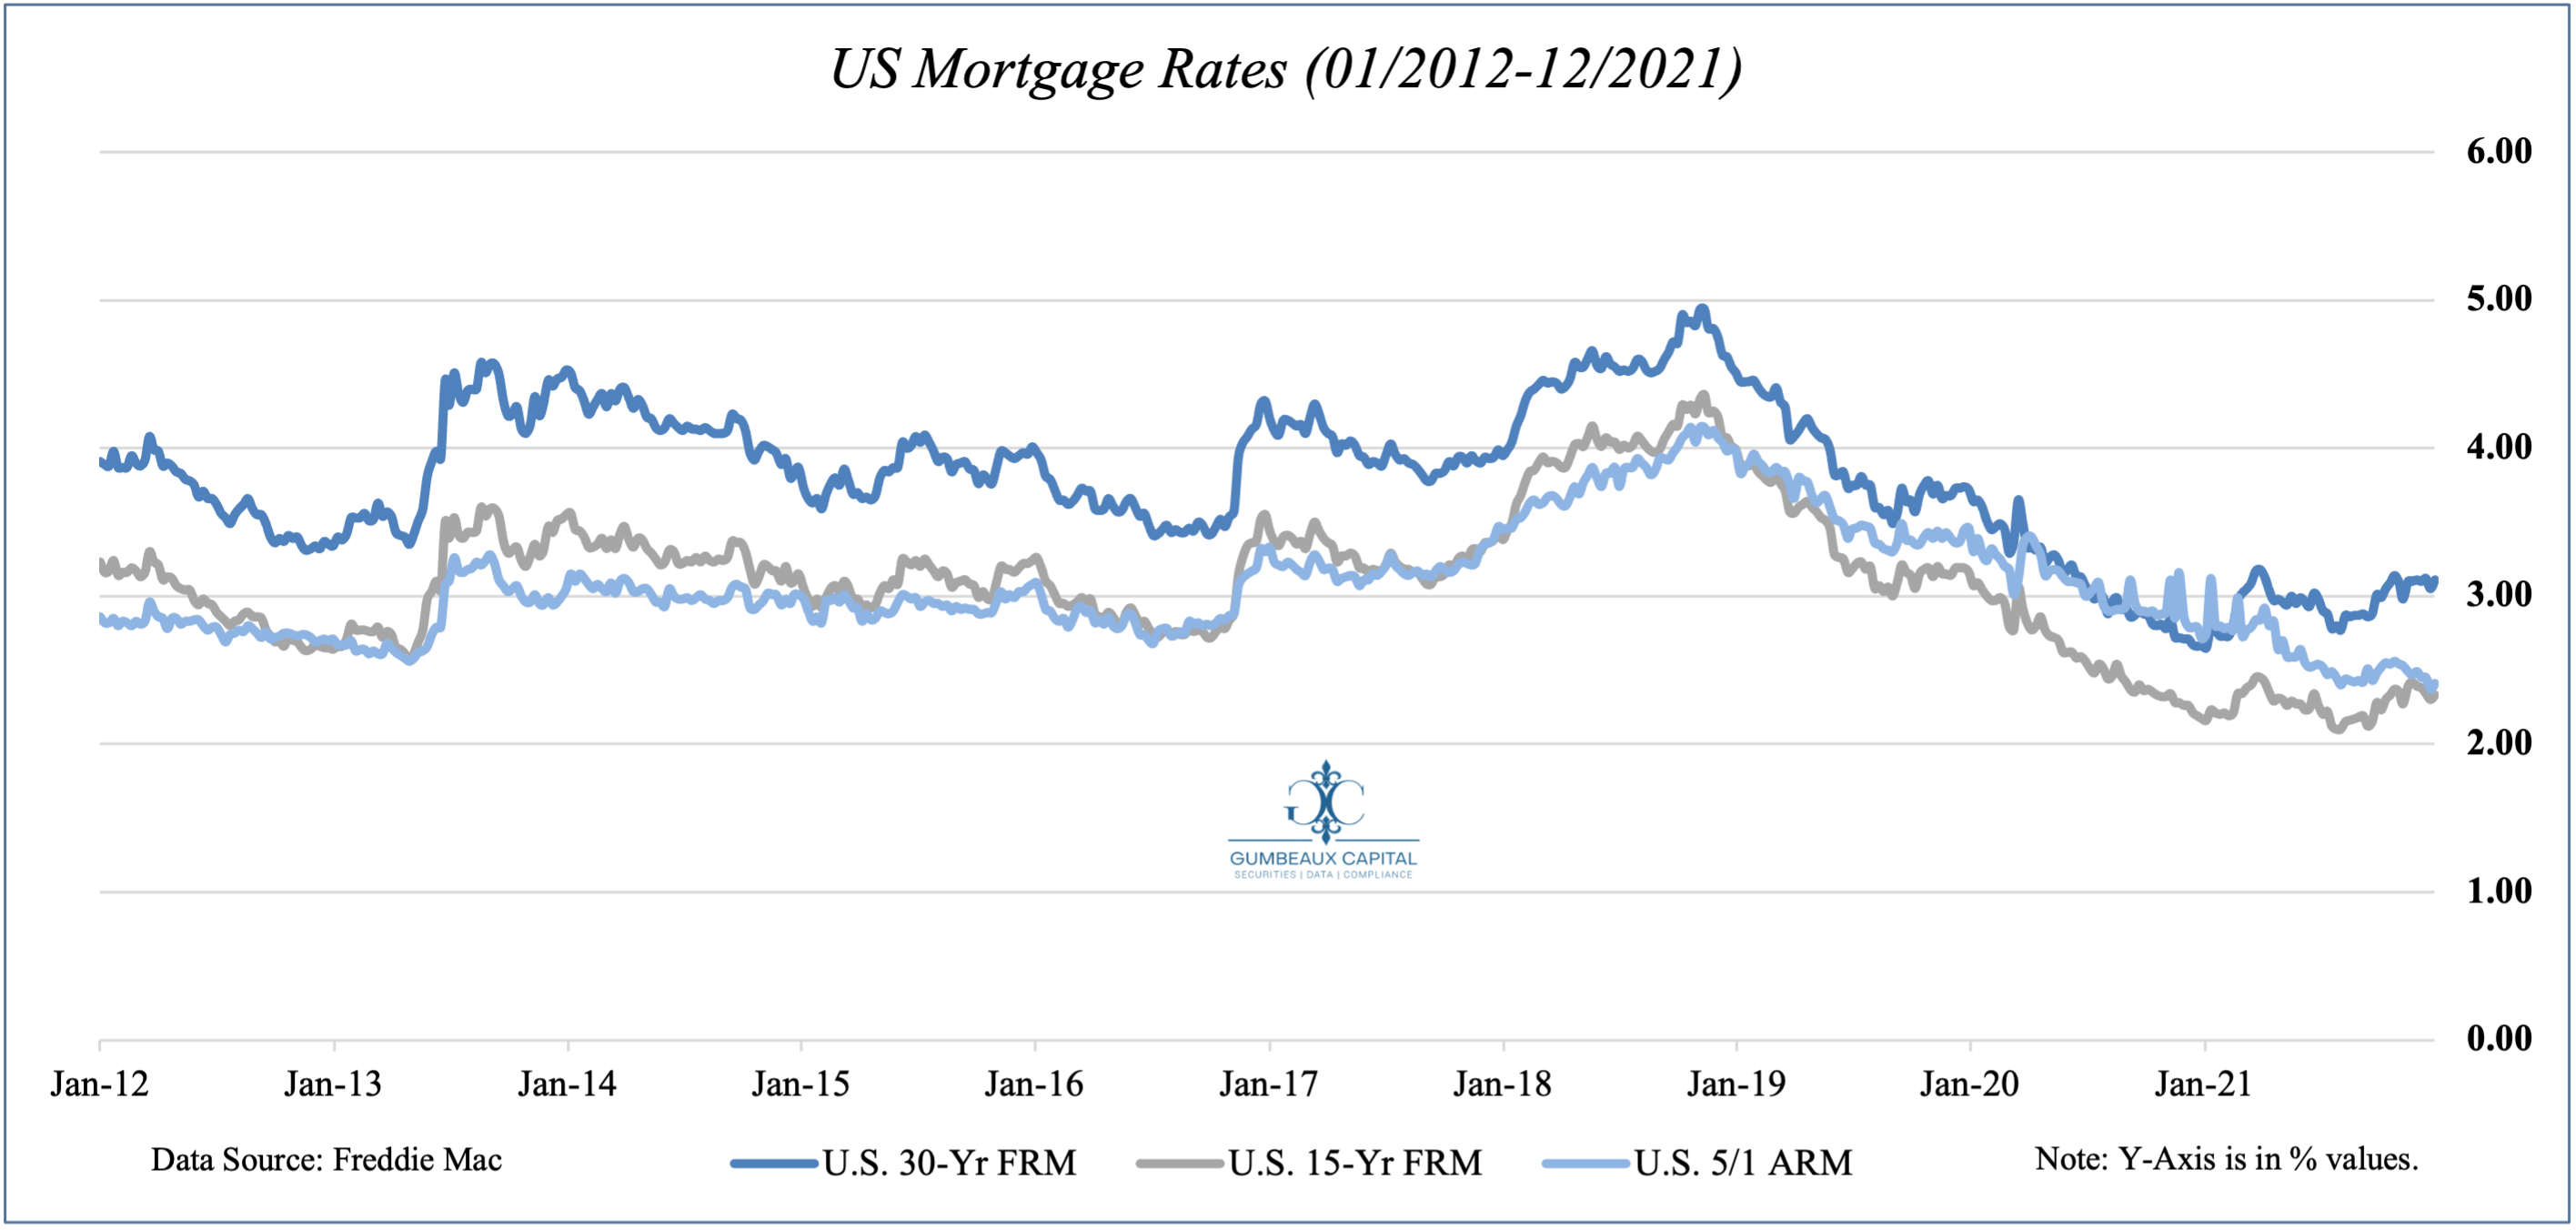
To extrapolate upon the imminent policy neutralization, we can take a look back at the 2013 “taper tantrum” activity in the context of mortgage rates. When looking back at the 2013 “Taper Tantrum” we can see an abundance of similarities in today’s dynamics:
The late January 2013 meeting carried a hawkish tone to it where the Federal Reserve’s “QE” program was in talks to be tapered out by year’s end. At the Fed’s March 2013 policy meeting, it was discussed that the Fed would “gradually” allow their balance sheet to shrink by letting the purchased bonds mature rather than selling them. In May of 2013, Fed Chairman Ben Bernanke spoke in front of Congress and commented, “If we see continued improvement and we have confidence that that’s going to be sustained then we could in the next few meetings … take a step down in our pace of purchases.” Bernanke’s comments caused bond yields to rise and equity prices to fall. Come June of 2013, the Fed had still not made a commitment to taper their bond purchases. It would not be until December of 2013 that the Federal Reserve began to commit to a tapering on their bond purchases. Through this time period we saw major increases in US Mortgage rates. We saw a 121 basis point jump in the 30-Yr FRM, an 89 basis point jump in the 15-Yr FRM, and a 35 basis point jump in the 5/1 ARM. It is key to note that also during this event, PCE inflation deviated between 1.4% and 1.7% at the time; this is in contrast to the PCE levels we see today at 4.85%.
With a sustainably higher price levels, the Fed has a lot more propensity to get significantly more aggressive on their tightening and tapering framework relative to 2013. At a base case, if we see an impulse in yields, and subsequently rates, we can expect to see 5.4% 30-Yr FRM, a 4.06% 15-Yr FRM, and a 3.47 5/1 ARM at the peak of the tightening cycle.
Rising Rates and Price Dynamics
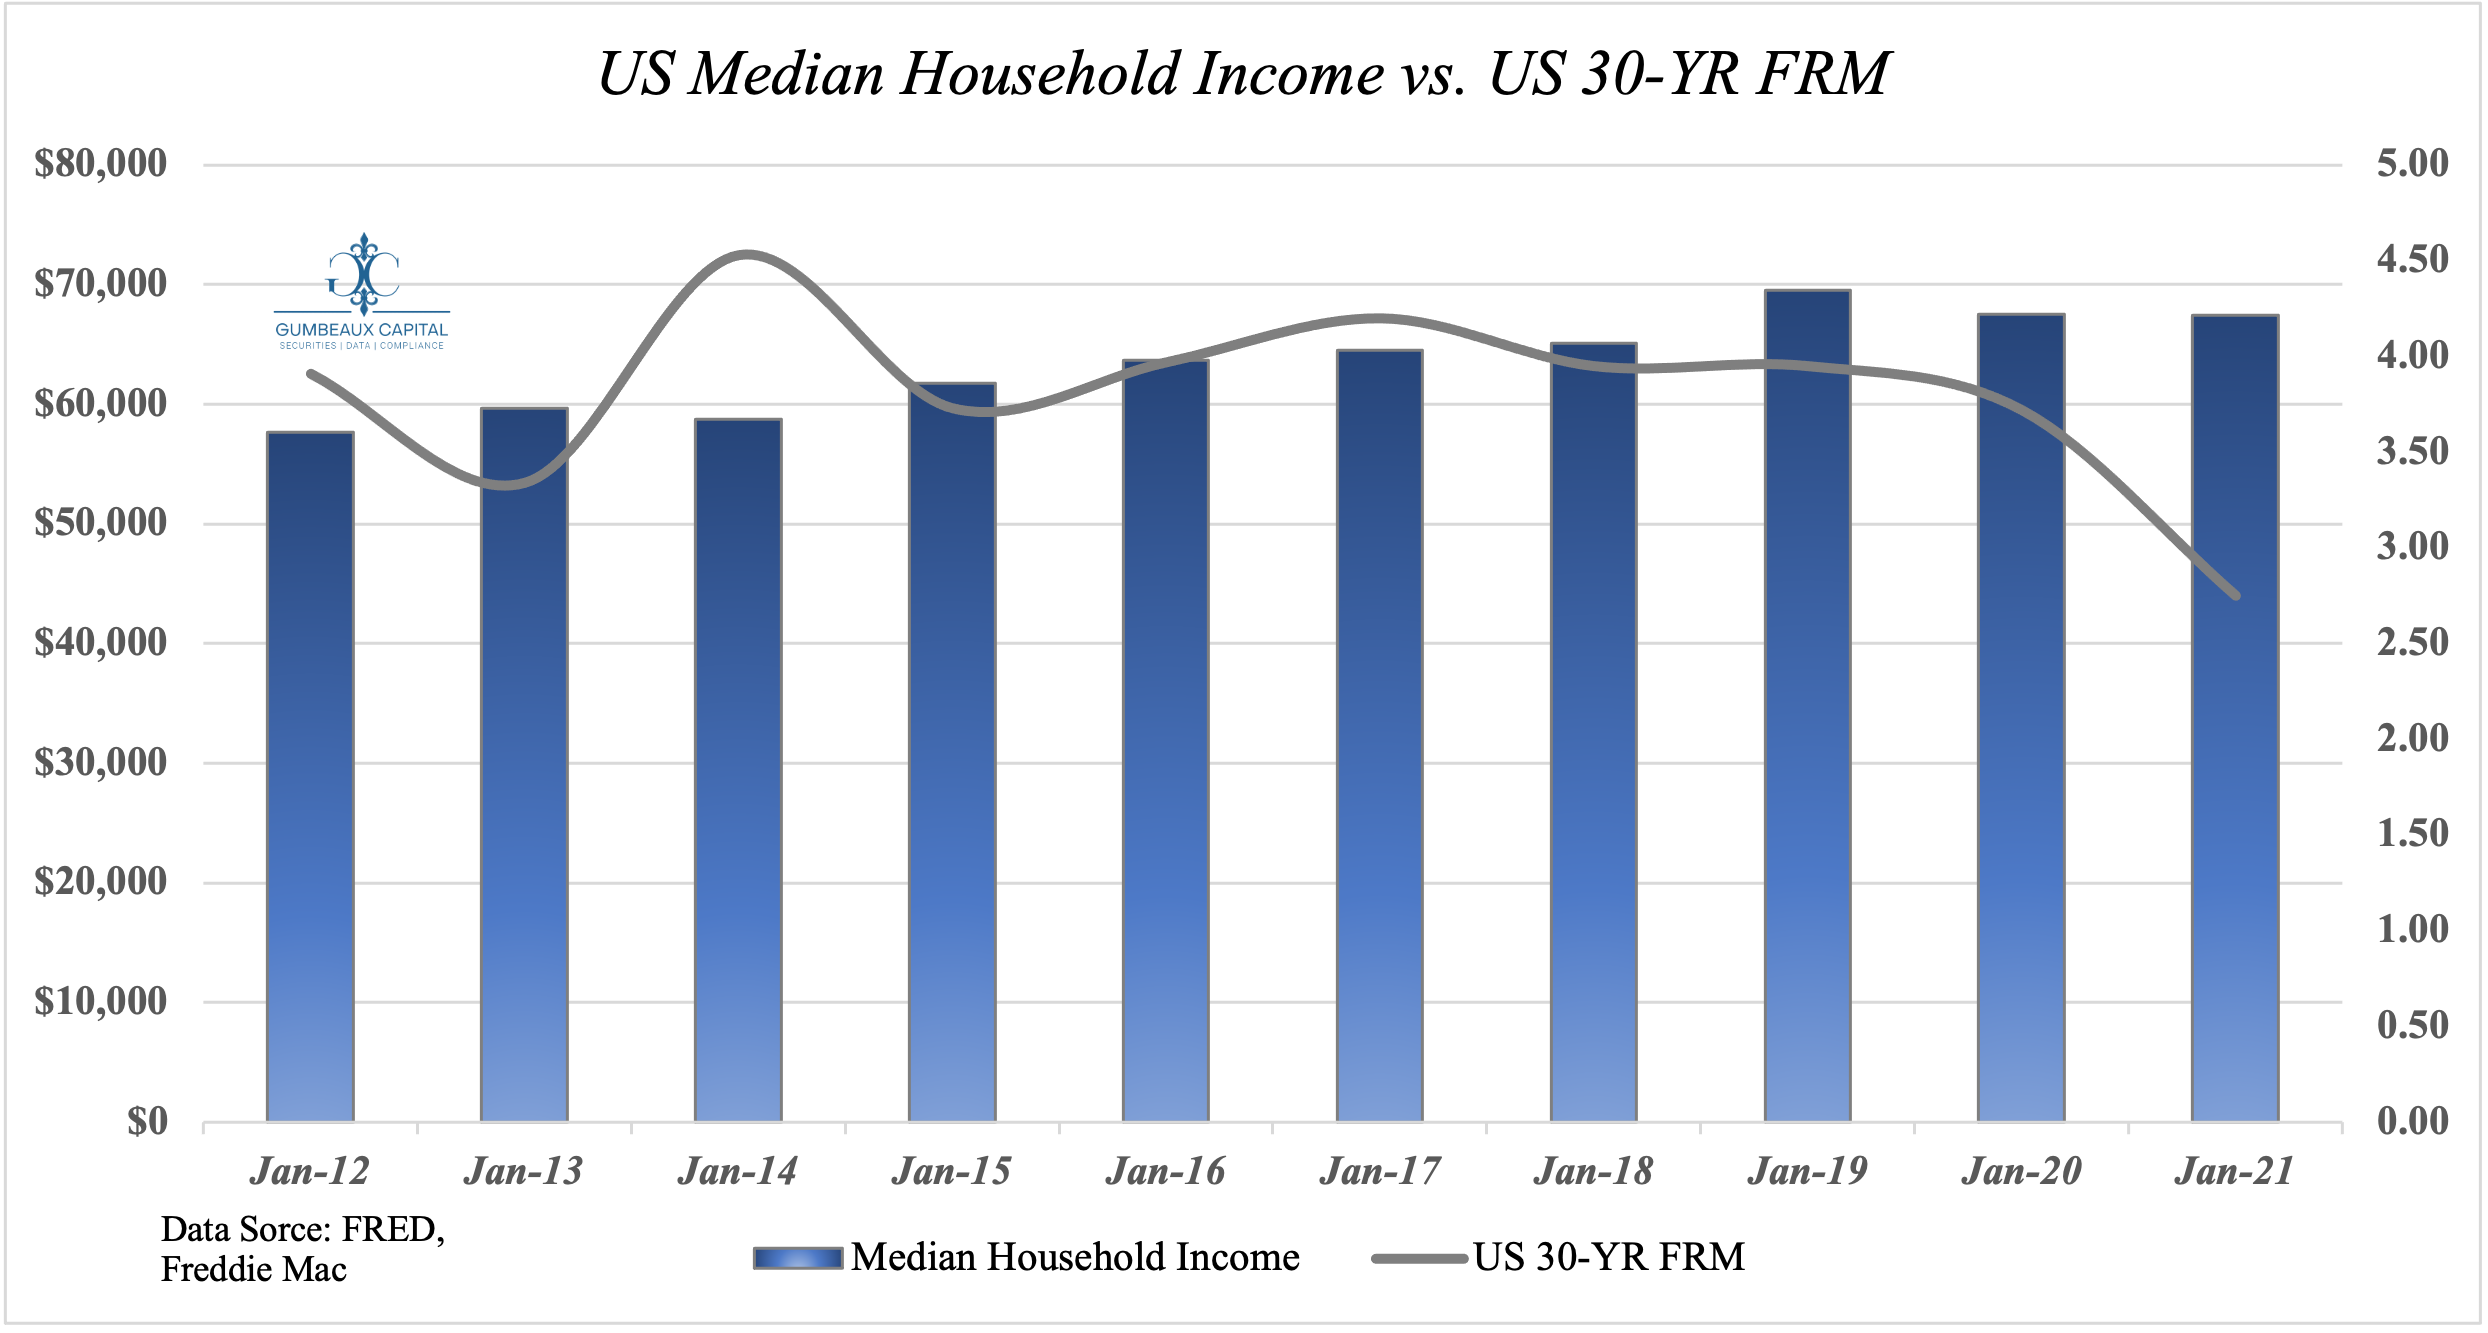
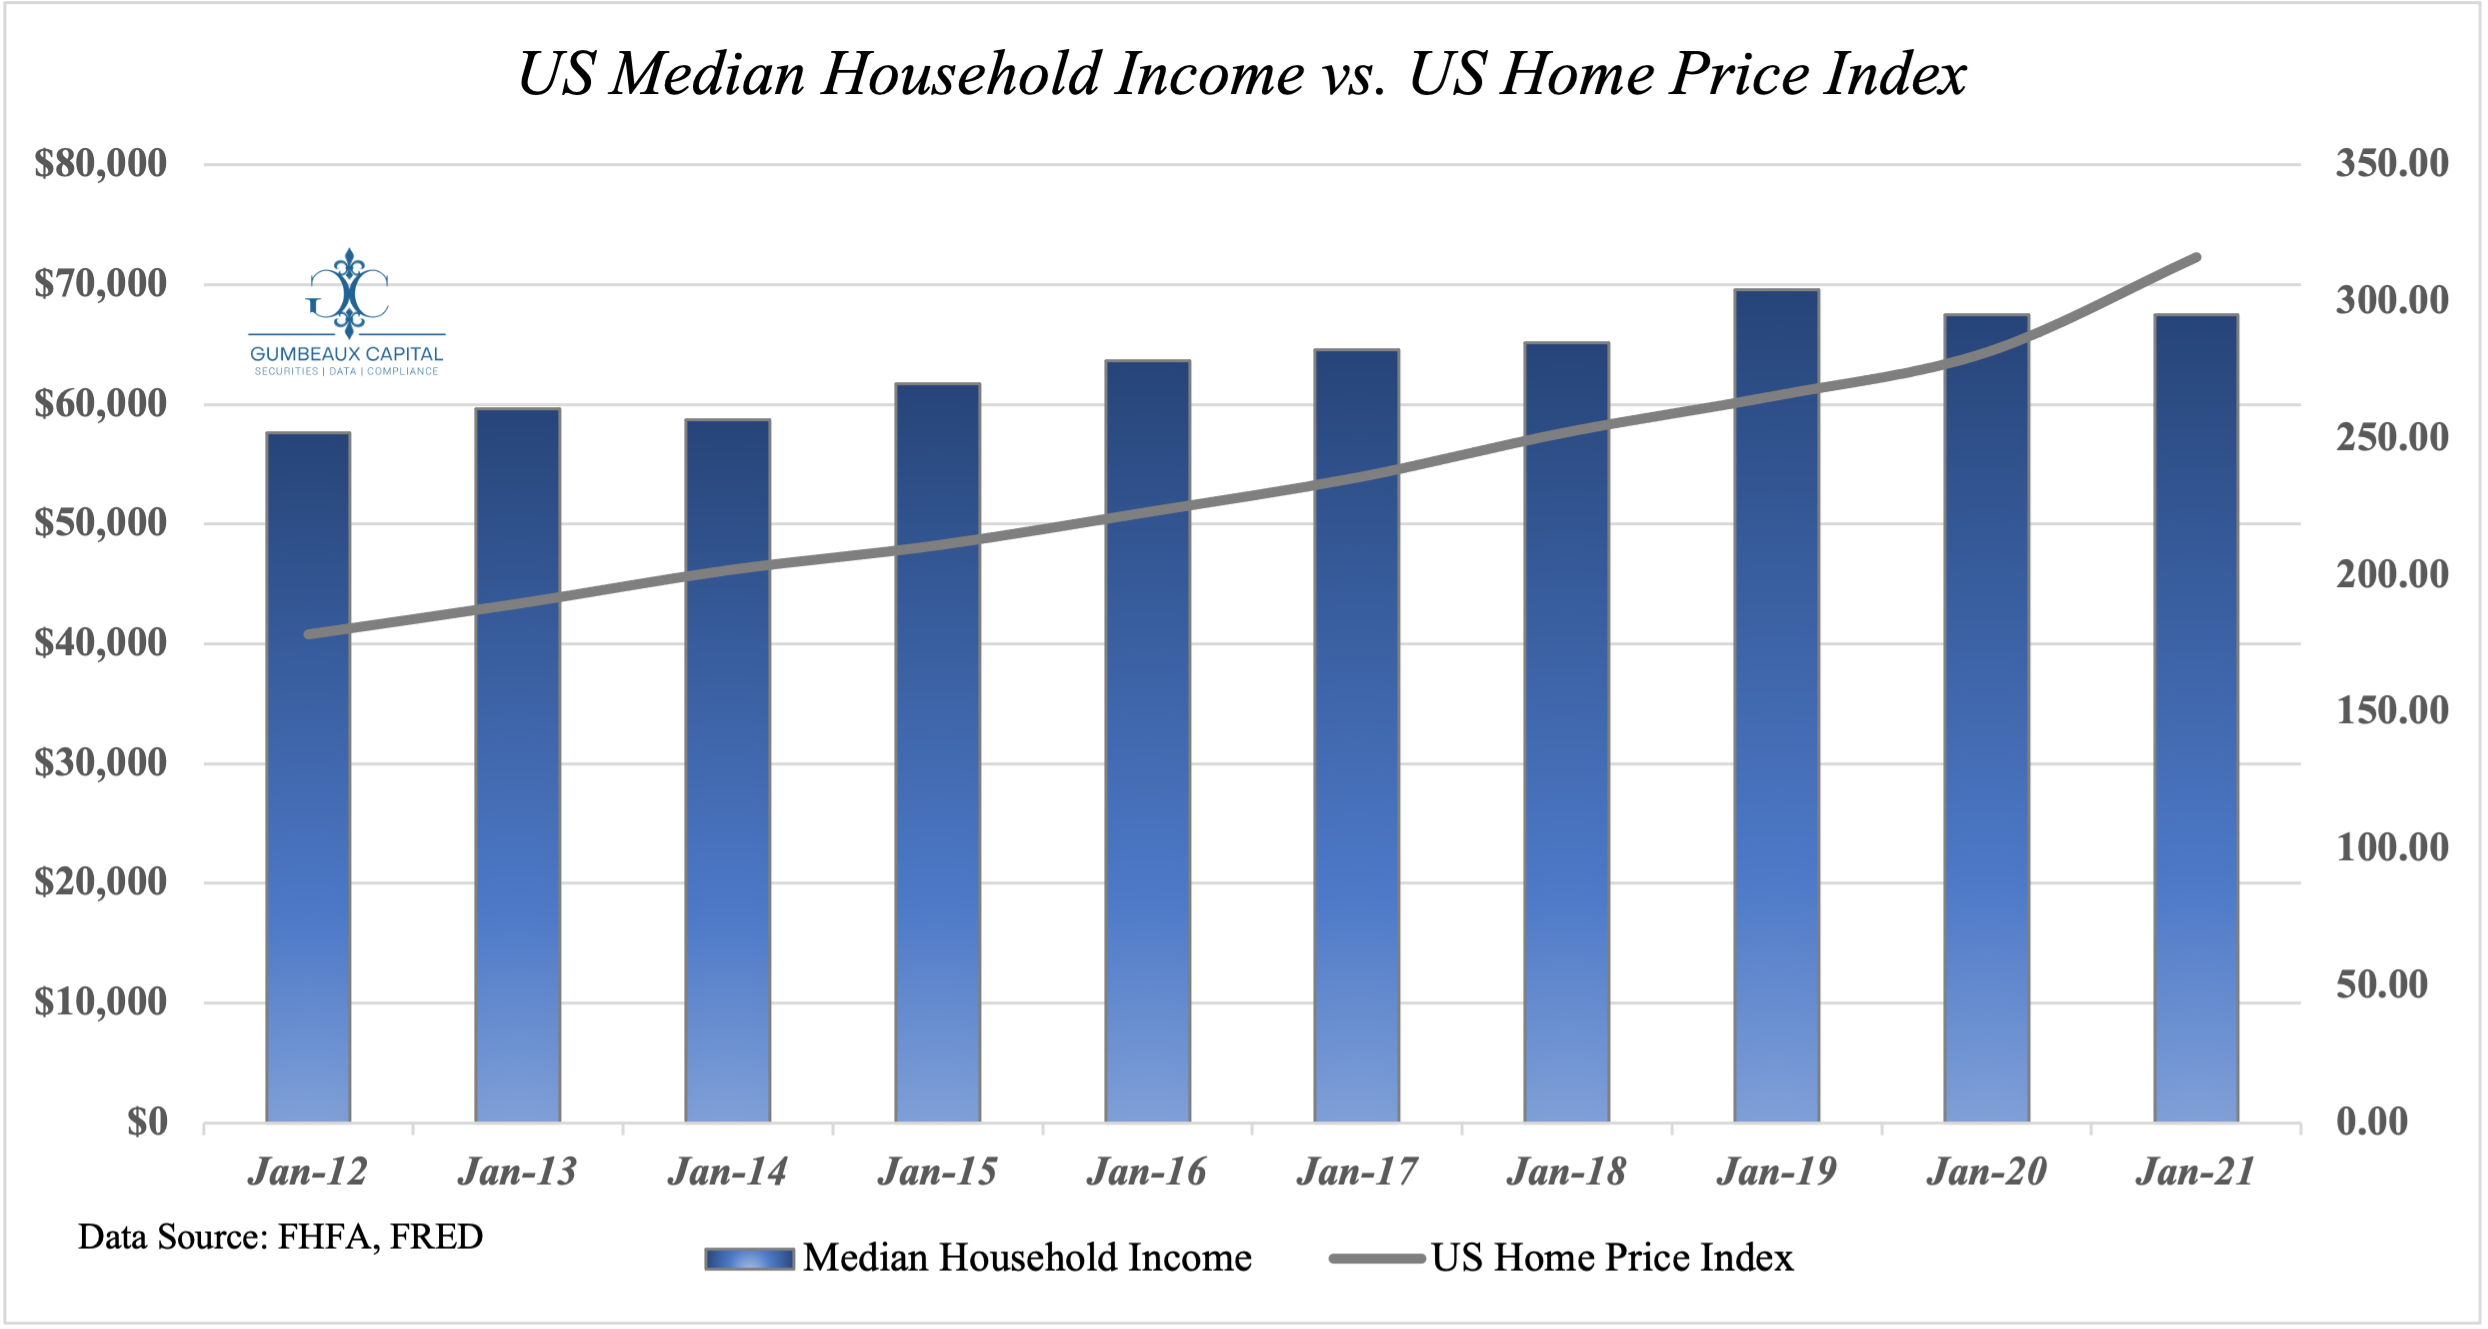
With the Federal Reserve bolstering accommodative policy through the pandemic, in which provided a gateway to higher household income; subsequently sending 30-Yr mortgage rates down 100 basis points from its January 2019 levels (Figure 3), and we saw home prices rise in tandem with household income (Figure 4).
With these dynamics in context, we can expect the inverse to extrapolate in a higher rate environment. We can note exogenously that higher interest rates cause household income to taper (along with access to credit), which in-turn will imply an easing effect on home prices.
Some tailwinds in the housing market may persist albeit the current labor picture in the US as the labor market continues to progress in its recovery. These dynamics may reduce the velocity of the impending household income taper, and soften the inherent reduced demand that we will experience amidst the Federal Reserve’s normalization policy initiatives.
Forward Strategy
To fully contextualize the outlook on the US housing market, following wage growth will be key in measuring the velocity of tailwinds pushing the housing market forward (for investors & lenders).
It will also be key for potential buyers to focus on their 2-5 year income outlook to offset the oncoming rate differentials relative to our current environment to mitigate any incurred real costs (higher rates and inflation). Having a strategic approach on expected future earnings will bolster an opportunity to take advantage of refinance programs at the completion of the normalization and tightening cycle.
]]>Pivotal Policy
The global monetary policy environment will be a key focus in 2022, as various leading economies seek policy shifts, and some seek policy perpetuation. This dynamic has brought upon some polarization in the global aggregate policy stance; particularly the contrast between emerging markets and top developed markets.
Given that liquidity has been the driving force for markets throughout the entire previous cycle, it cannot be disregarded when contextualizing the dynamics of the upcoming economic cycle. To properly contextualize what will be evident in the upcoming economic cycle, we must assess the largest players in global liquidity and their liquidity instruments.
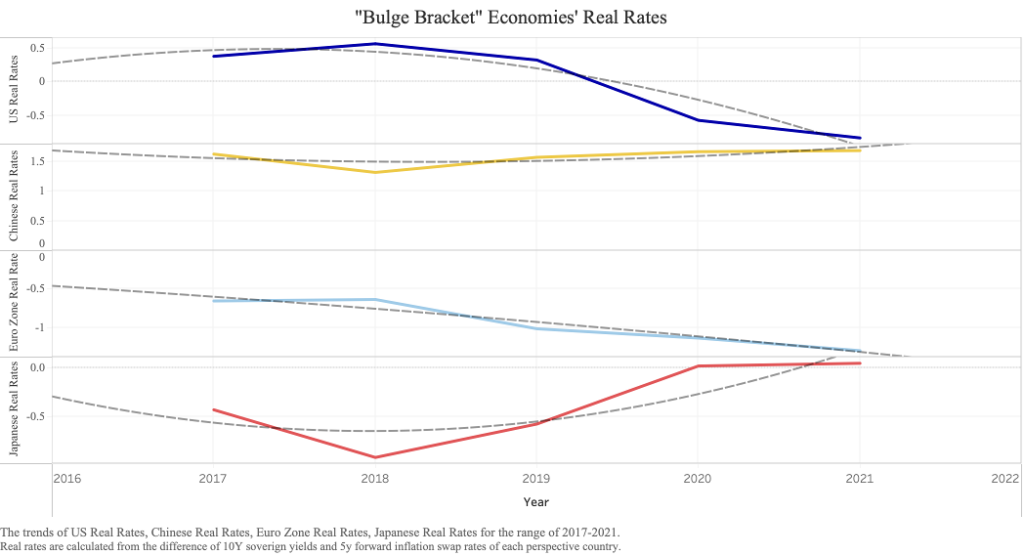
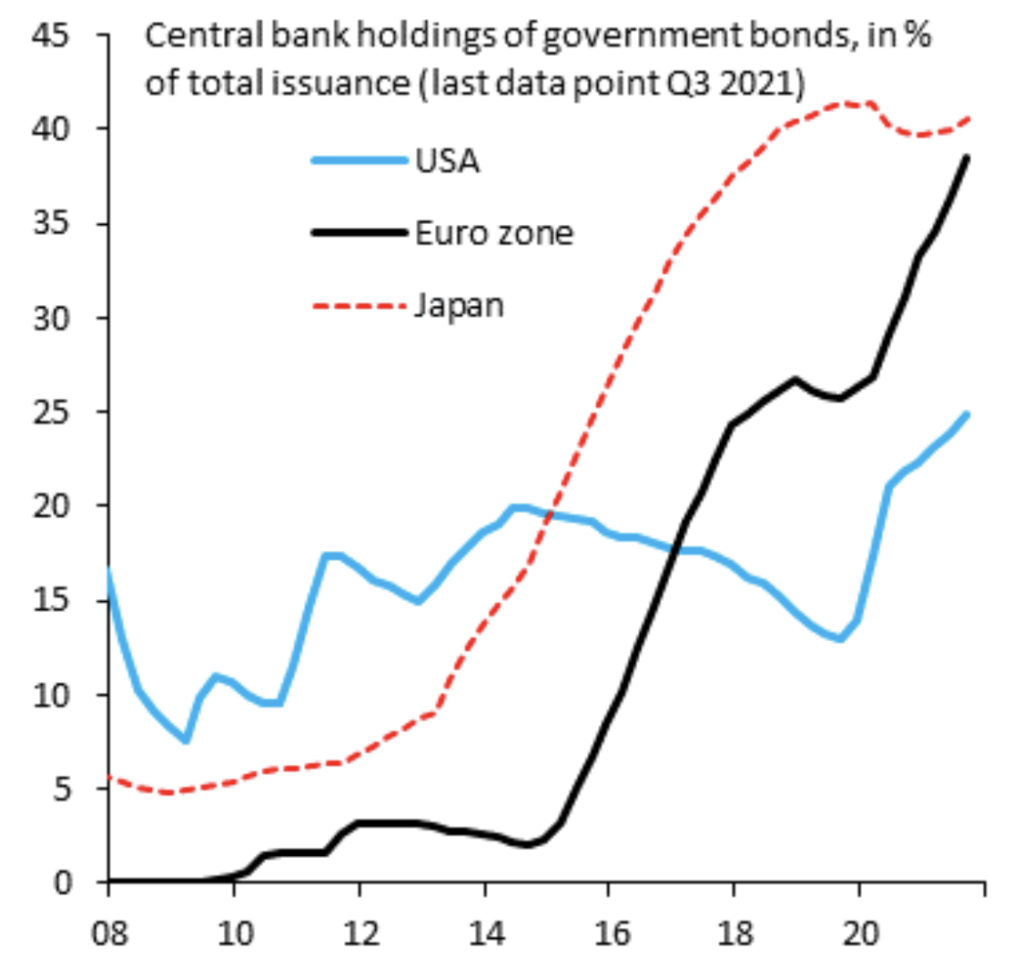
With all 4 of the leading economies implementing accommodative policies throughout the pandemic and 1H 2021, it has caused an interesting picture in terms of real rates. Given that “unconventional” monetary policy was the dominant force in nominal rates over this cycle of accommodative policies, the forward capacity of debt capital markets and money markets have served as the leading principal on capital flows. This is why policy has now become very pivotal in the recovery phase for the developed economies, as capital flows and investment will be the key driver of long-term growth in lieu of government expenditures (the key driver of the 2010s), and net-exports (de-globalization thematic).
To unpack this, when looking at the developed basket’s real rates (Figure 1), we can see that all of the top 4 economies are ranging close to the 0% mark, and in the case of the US and the Euro-Zone, we can see negative real rates. With China and Japan, we can see real rates remaining rangebound right above the 0% mark. The real question is, will these trends perpetuate?
US Real Rates
For the United States, the picture is likely the clearest. With an expected hawkish stance from the FOMC minutes on Wednesday, January 6th, 2022, we will continue to see a tapering in asset purchases from the Fed and nominal rate hikes until the Fed can reach their price stability mandate.
There are still some risks to the tapering and tightening picture though. For example, the Fed still has a close eye on employment figures, and more closely on the labor-force participation rate (LFPR) in particular. With a record number of 4.5 million people leaving their jobs in November, and relatively robust JOLTS reports, these conditions may create some turbulence in the steadfast tapering framework from the Fed. This may lean the Fed to keep credit spreads relatively tighter to accommodate the labor force respectively for the time being before their first FOMC meeting in late January, and or the following FOMC meeting in mid-March. Nonetheless, short term securities will certainly experience high volatility until the Fed decides on a set benchmark for nominal rates.
Although, to no surprise, the Fed will look to increase rates to curb recent inflationary pressures within the US economy. Inflation was the key driver of sending real US rates into negative territory, but how much can the Fed do to curb inflation?
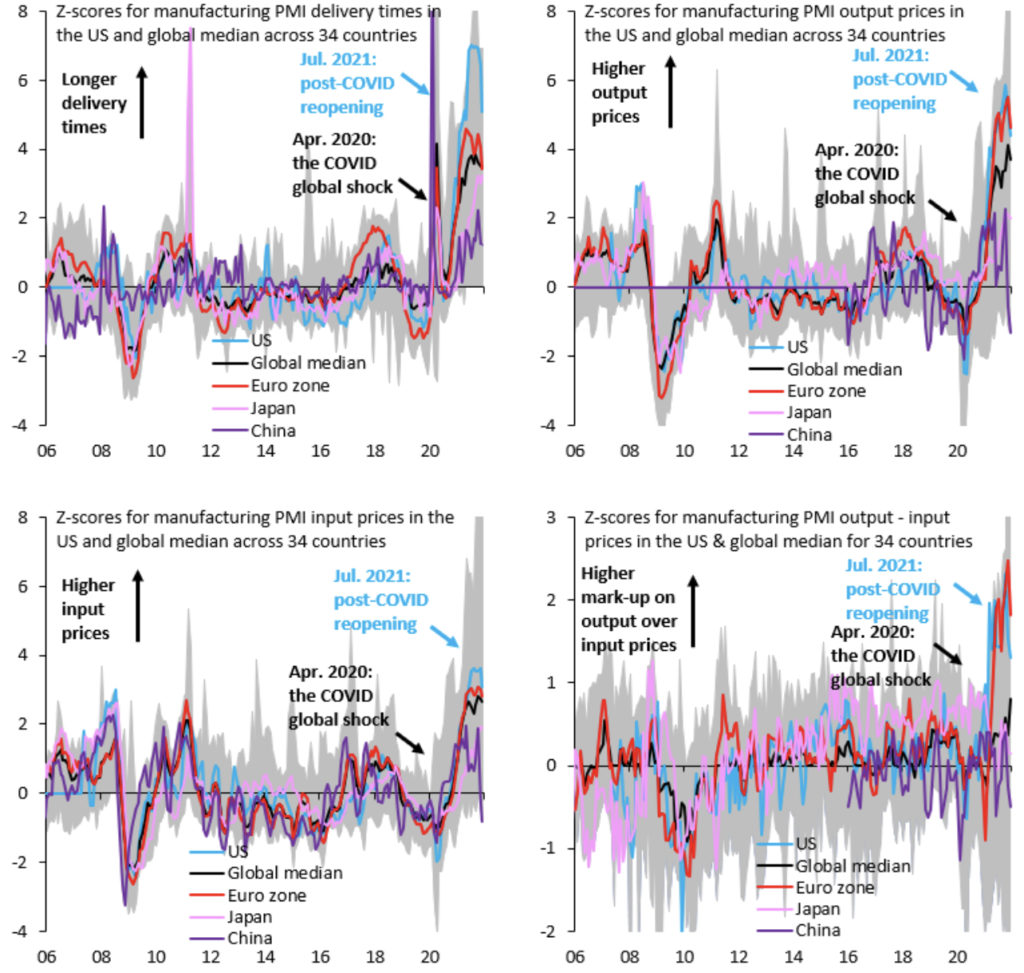
As we can see in Figure 2, the thematic of the supply chain crisis is now waning, and long-run aggregate supply isn’t as much as a worry (ceterus paribus) as beforehand, but with tighter financial conditions comes tighter growth conditions, so unless there is another serious demand shock… (which despite the US having its highest Inflation prints since 1982, US consumer confidence ended 2021 on a high note) short-run aggregate supply may be at detriment. This could cause the economy to undershoot its supply equilibrium, and keep price levels higher than intended thus elevating the 5y/5y forward swap rates, and subsequently lowering real rates (regardless of where 10y-yields head towards). In the event that this happens, long-run aggregate supply will be at risk again, and so will employment figures (natural rate of employment = LRAS) leaving financial and economic conditions where they remain today.
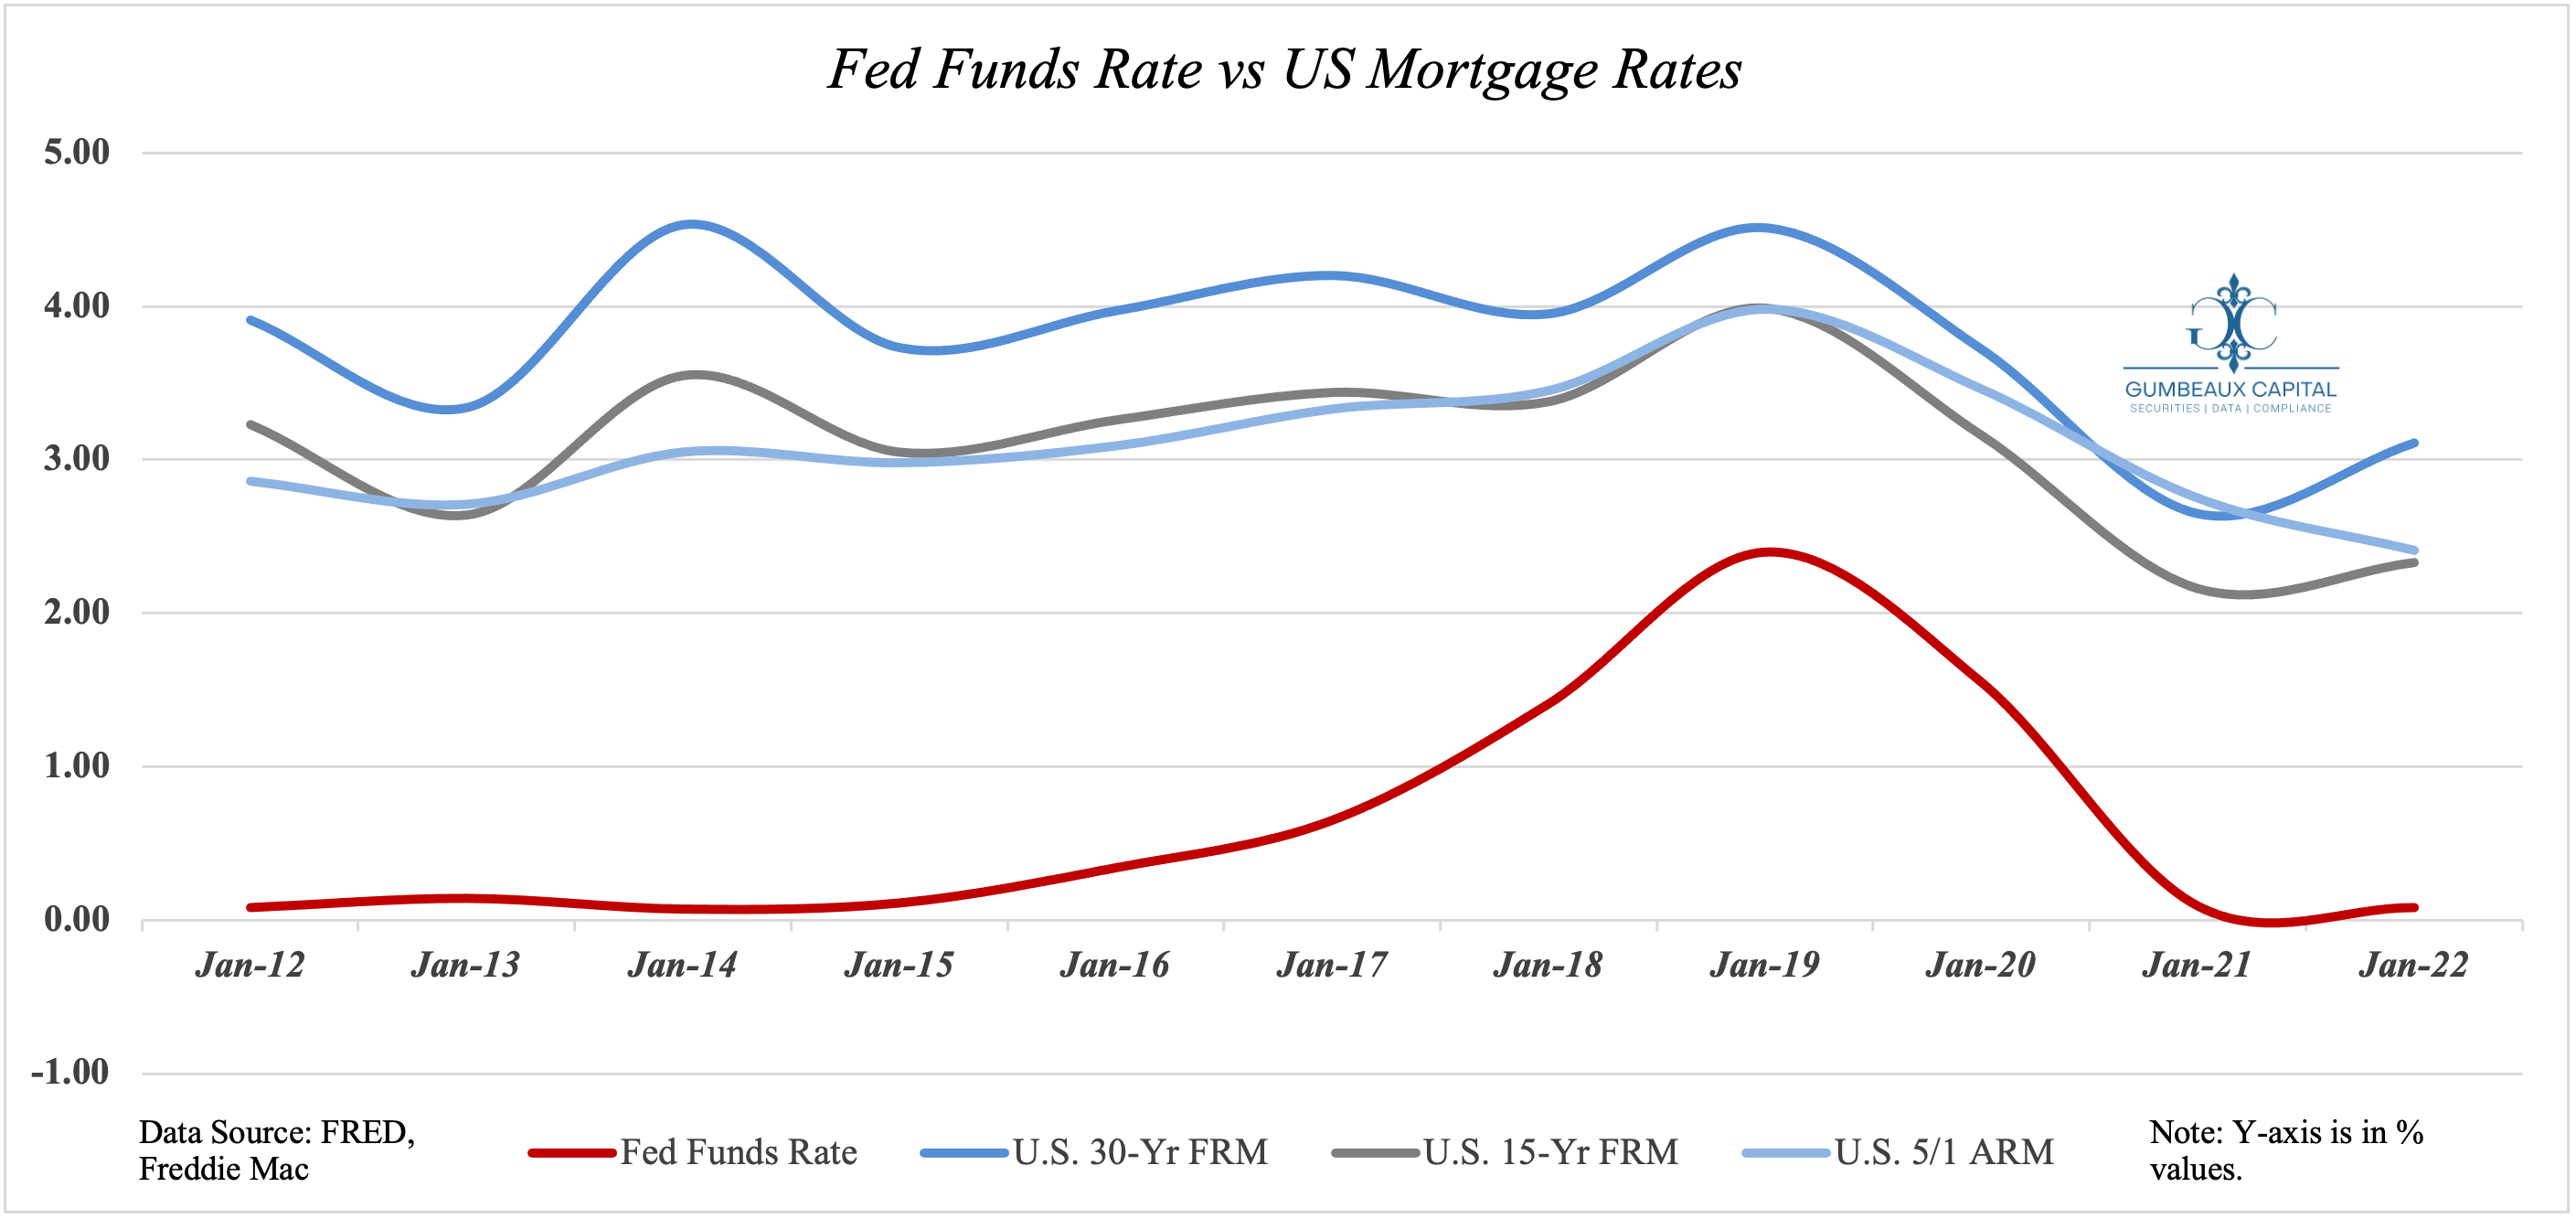
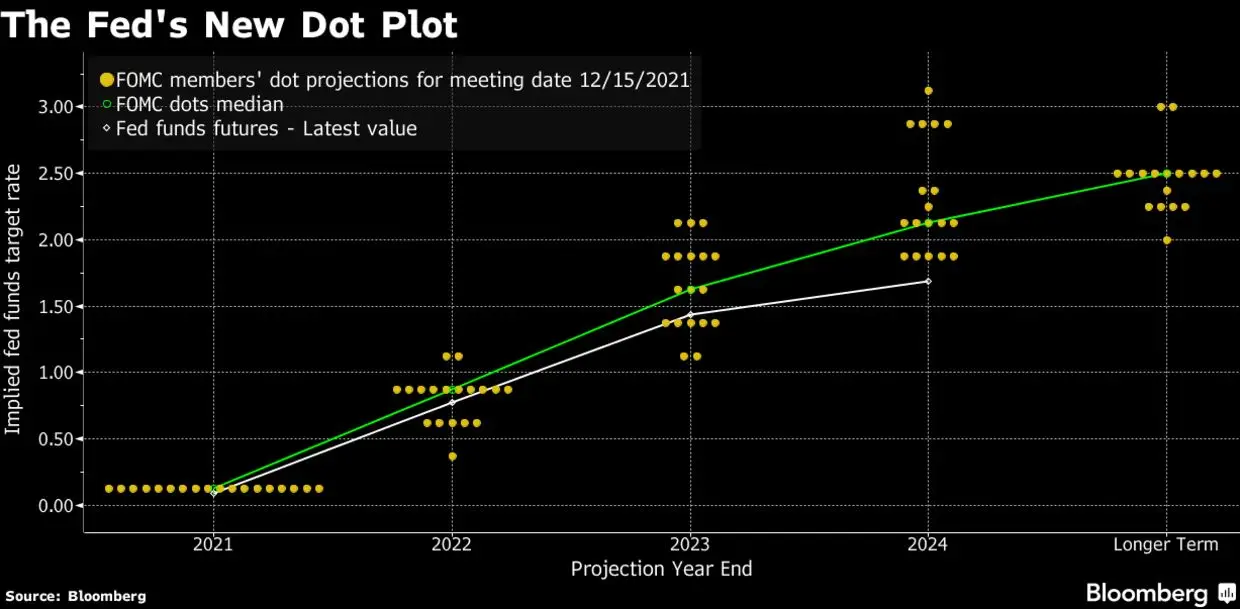
Given that long term growth is going to be dependent on inflows to capital markets to service the debt of today’s (growth-oriented) expenditures, the Fed may undershoot the general hawkish expectations (Figure 3), and take more of a steady (still hawkish) approach to their tightening framework relative to the recent aggressively hawkish tones from Fed affiliates, in aim to promote risk-stability in markets while easing inflationary pressures.
Chinese Real Rates
The Chinese picture is an interesting picture, as China has now implemented itself into the “bulge bracket” economies, and is the core of the global supply chain for a large basket of goods. China is likely at the most pivotal point regarding policy from an internal standpoint, as they aim to solidify themselves as an economic powerhouse and shift the global economy to a multipolar setting regarding the US.
Nonetheless, China has some complex idiosyncratic risks. Luckily for China, they have positive real rates to work with, which indicate that they have a bit more room to proceed with more accommodative economic policies before capital allocation indifferences become a risk on forward growth (rising real rates from global counterparts).
With the general economy pointing China at lower growth targets for 2022 (sluggish retail sales, and the real estate liquidity crisis), the PBOC may look to keeping the premium of higher real rates via tightening credit conditions, but accommodating for liquidity needs via unconventional policy. To further contextualize the Chinese picture… as the US looks to taper and tighten, the Chinese may look to only taper as they have the suitable capacity to do so. This is further reflected as PBOC Governor Yi Gang recently “vowed to keep a “normal” monetary policy for as long as possible and avoid large-scale stimulus.”
All in all, as long as the risks from the leverage busts in the Chinese real estate sector, remain akin to the sector and akin to the local economy, and or can possibly be mitigated… look for Chinese growth to continue on a healthy trend, unless there is another serious global and domestic demand shock.
Euro-Zone Real Rates
In the Euro-Zone’s environment, things prove to be pretty tricky as the decline real rates begins to steepen (50bps since 2017). Given that Euro Zone 5y5y forward swap rates remain steady, and even slightly decreasing, we can attribute the fall in real rates towards the aggressive ECB QE (Figure 4).
Even though the “ECB Governing Council judges that the progress on economic recovery and towards its medium-term inflation target permits a step-by-step reduction in the pace of its asset purchases over the coming quarters,” the ECB still remains widely accommodative relative to its “bulge bracket” counterparts. The ECB suggests that, “monetary accommodation is still needed for inflation to stabilise at the 2% inflation target over the medium term. In view of the current uncertainty, the Governing Council needs to maintain flexibility and optionality in the conduct of monetary policy,” thus the “Governing Council decided on a monthly net purchase pace of €40 billion in the second quarter and €30 billion in the third quarter under the APP. From October 2022 onwards, the Governing Council will maintain net asset purchases under the APP at a monthly pace of €20 billion for as long as necessary to reinforce the accommodative impact of its policy rates. The Governing Council expects net purchases to end shortly before it starts raising the key ECB interest rates.”
Pairing this dynamic with the fact that Italy and Germany are sitting at the top end of global unemployment rates, we can conclude that the Euro Zone has a LRAS, and aggregate demand issue. This indicates that the optimal policy stance is out of the hands of the ECB at this point, and a collective fiscal effort of the ECB is greatly needed to protect long term growth objectives, and to hedge against any impulses in growth for the near-term.
Euro Zone Governments may be reluctant to provide ample fiscal support to the economy as the Euro remains relatively strong, as even with an extremely strong USD, the EUR/USD spot continues to trade at 1.13 which makes it certainly hard for the Euro Zone to reflate to optimal price levels in real terms. This in turn, may lead to a rate target stagnation from the ECB which can possibly ease Euro strength, induce aggregate demand, and allow EU nations to actively assess their perspective fiscal environments to support LRAS (+ natural rate of employment.)
Japanese Real Rates
With Japan sitting at positive real rates for the first time since initial QE, there are a some dynamics to question. Given that 10y yields have remained relatively unchanged since 2017, but real rates have risen accordingly, we can attribute this environment to the lingering “under-inflation” that Japan deals with. Despite energy and food costs are pushing up prices in Japan, inflation remains well below the BOJ’s 2% target as weak consumption discourages firms from passing on higher costs to households. A BOJ member even stated, “Monetary policy will be normalised in Japan when the price target is achieved in a stable manner irrespective of policy developments in other economies,” “Given the target has not been achieved, there is absolutely no reason to adjust monetary easing.”
Japan’s situation is highly similar to the EU, but with a relatively weaker currency, and a deeper structural “under-inflation” issue. Further accommodative policies are inevitable in Japan, and the Yen should counterintuitively stabilize if the BOJ can meet its targets due to the fact that the “under-inflaton” is derived from a lack of aggregate demand.
Consumer confidence, lending activity, and net exports will be the key indicators on the future dynamics of the Japanese economy, and its safe haven status.
Risk Dilemma
Given that our “bulge bracket” of economies are dealing with some robust uncertainties going forward, the search for a “safe haven” may be tricky… This can be extrapolated with the EM capital flow environment (Figure 5).
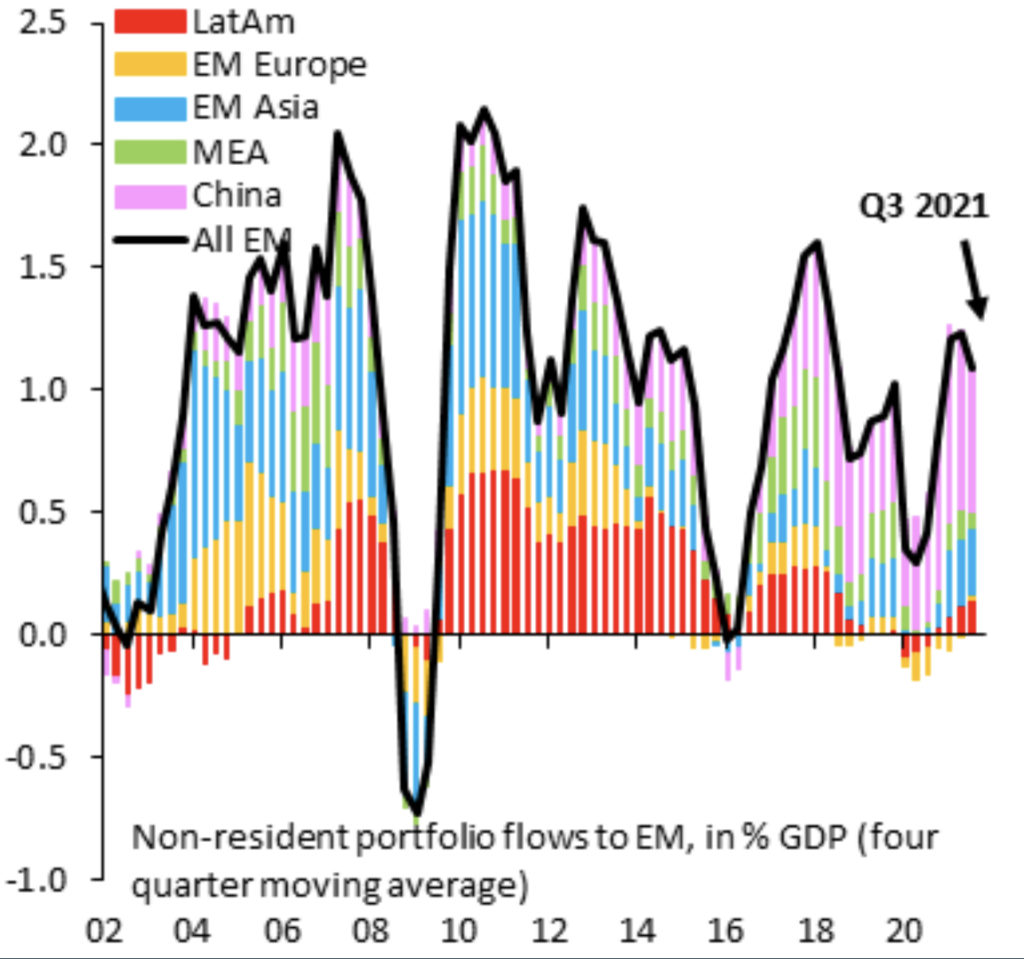
This shows that EM portfolio flows outside of China have been non-existent, signaling an illiquidity crisis going forward for emerging markets excluding China. Despite emerging markets offering higher relative yields than “bulge bracket” safe haven nations, tighter aggregate financial conditions may reduce the already drying up liquidity from the EM basket. 2022 will certainly not be the best year for EMs as a whole (Debt, Equities,FX).
FX
Carrying on from the EM risk dilemma, the FX outlook is simple “bulge bracket” (USD, EUR, JPY, CNY) vs EM, and given the idiosyncratic position of the US… look for USD to continue dominate the FX markets in 2022 from a liquidity standpoint, and a fundamental standpoint.
Equity Fallout
The same dynamic we see in the aggregate market for EM’s is the same dynamic we will see for equities. An aggregate tightening in credit conditions, and a subsequent tightening in monetary policy will reduce aggregate liquidity from the equity markets as per expected, but given that the entire previous cycle was derived by accommodative policy and looser credit conditions, liquidity dynamics have allowed equity valuations to rise above fair and earnings based equilibriums.
Given, equity prices are currently subject to the forward ability for companies to generate increased free cash flow and earnings, but with a net tightening on financial conditions, we just do not see how aggregate demand will sustain itself to continue to boost FCF and EPS; allowing for an imbalance fill in equity indexes and individual equities respectively.
Digital Assets
Just as we covered with equities, digital assets will see price levels return to their intrinsic valuations with respects to their aggregate demand. The liquidity driven market may be primed to be hit the hardest in the midst of tightening financial conditions.
Commodities
Within the area of commodities, in 2022, energy will take the spotlight. As energy production and provision travels through regulatory headwinds, there are plenty of fundamental/demand derived tailwinds for the energy sector.
Nonetheless, inventory dynamics (build/draw) will be the core price determinants, and liquidity buffering will subside for the FY2022.
Oil
Oil prices may stagnate due to the fact that oil demand will continue to catch up to the current price equilibrium, but will be mitigated by non-OPEC producers servicing the market in ample volumes.
It is also key to note that open interest on oil has hit a cycle low even with a spot price above $70/bbl.
Coal
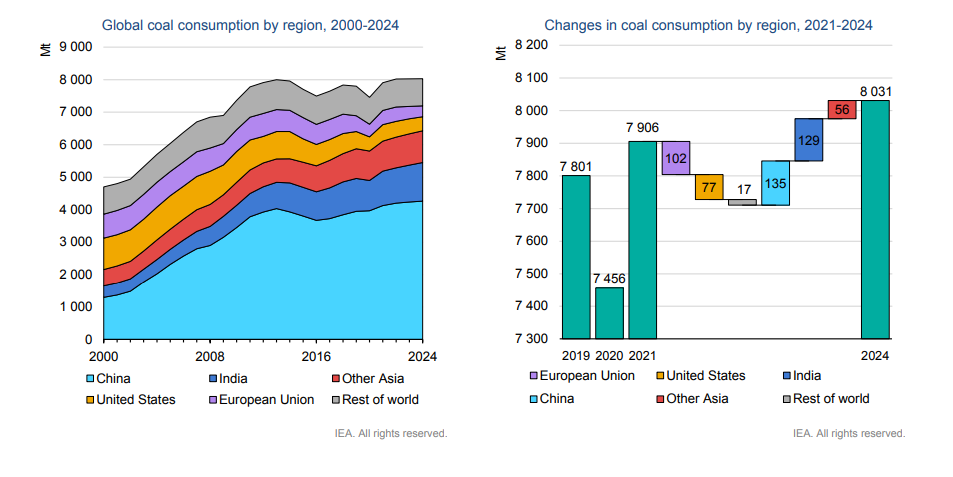
With many regulatory headwinds locked on to coal, coal prices will certainly experience some volatility. One thing to keep an eye on will be the dynamic that coal demand is poised to increase throughout the next 3 years (Figure 6)
Precious Metals
Precious metals will face headwinds from net policy shifts, and subsequently changing liquidity dynamics. Albeit the inflation cloud still looms over the global economy, precious metal prices should see short term volatility until there is further net-clarification on the global policy stance.
Industrial Metals
Aluminum and copper will be the focus of the industrial metal sector where both metals face supply side volatility due to regulatory headwinds.
Aluminum
Aluminum production will continue to further be constrained by the net-0 policies across the globe to to the high carbon output aluminum production carries. This dynamic could certainly create an upside imbalance for aluminum as demand will inelastically rise despite the supply-side headwinds.
Copper
As many large miners scale back their copper extraction, copper inventories are poised to overshoot equilibrium value to maintain price, and with a stronger dollar In the picture, copper prices may experience downside pressures in 2022.
Agriculture
Global agriculture stocks (inventory) have been persistently lower throughout 2021. Dependent on the increasingly volatile weather dynamics (La Niña), the outlook on agriculture stocks (inventory) are unclear at the moment. Nonetheless with supply chain bottlenecks looking to ease, agriculture goods prices should slightly lower in 2022.
Fundamentals (Cycles) Matter!
2022 will not be a simple market to participate in relative to the past 3 years. Liquidity will be reduced as we enter a net tightening of financial conditions, and fundamentals will reign as king again. Growth (LRAS) and aggregate demand will be the key determinants of liquidity (inflows), and defensives should be a top priority for each investor’s portfolio for 2022.
]]>Strategic Growth vs. Fiscal Responsibility
In the midst of a political battle within the US (China’s biggest economic and geopolitical competitor) in regard to an impending $1.25 trillion infrastructure bill, it is evident that the premise of the political battle in DC is in regard to the price tag, and subsequently the marginal benefit of said bill; more or less the fiscal responsibility of the bill. Though improved infrastructure is a great way to increase employment alongside the labor force participation rate, and in overall, promote economic growth; a fiscally irresponsible effort on infrastructure development can cause detrimental effects in the long-run for an economy, and the financial health of an economy… let alone the global economy, with respects to the magnitude of nations like the US and China.
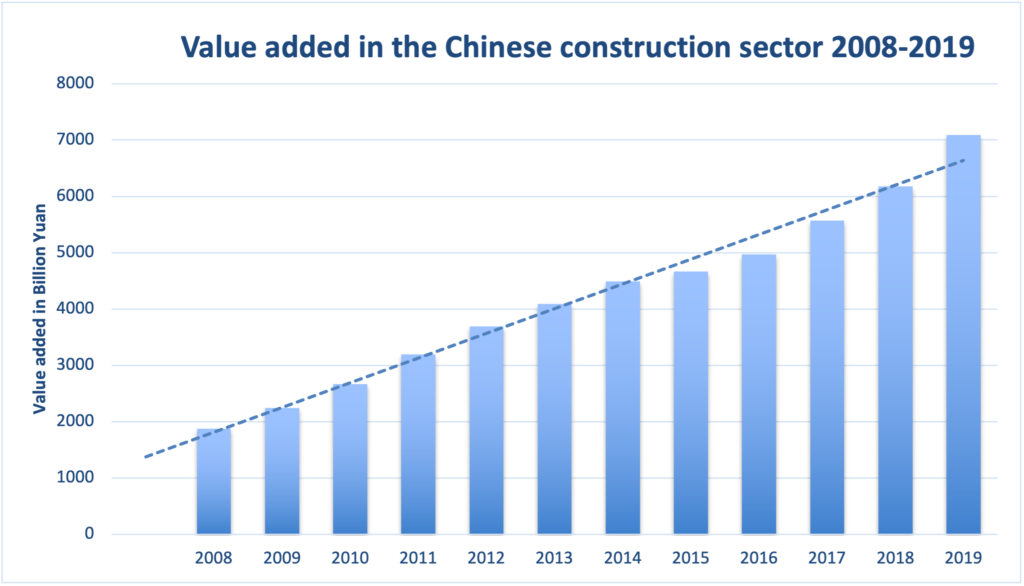
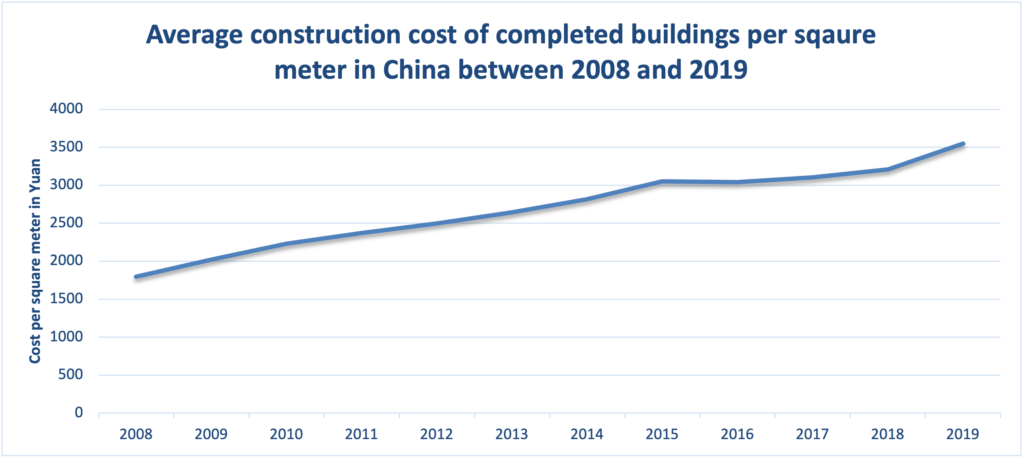
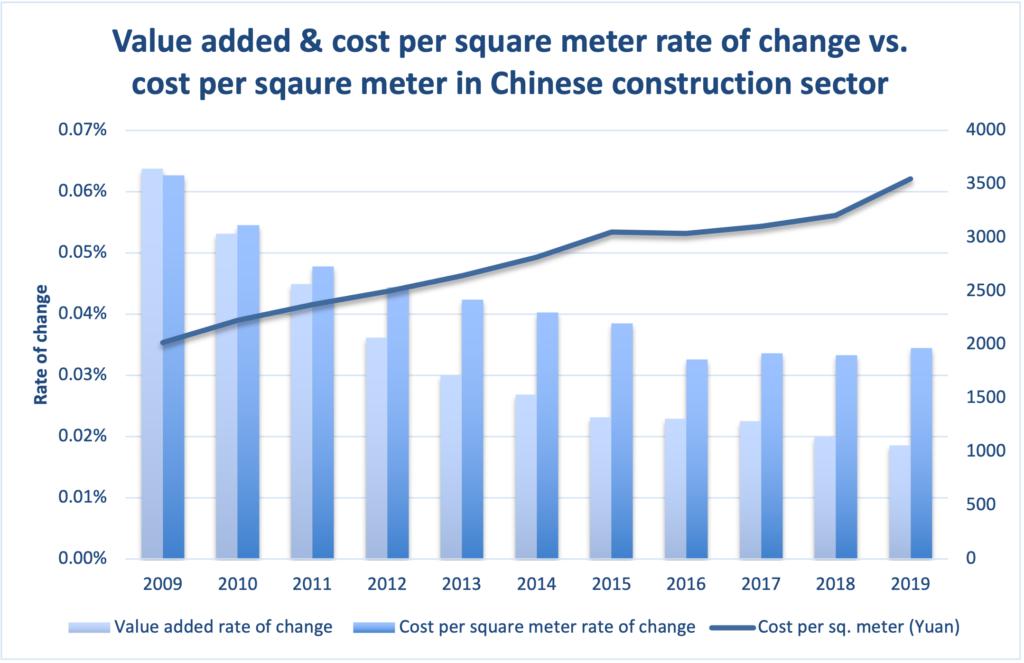
Given the state of the US and its infrastructure, and the dynamics of the geopolitical tensions that have recently been rising between China and the US, China sought out infrastructure as a strategic investment to increase its economic footprint on the global economy, and to bolster its multilateral initiatives (i.e., Belt Road Initiative). This strategic investment initiative, though making China the largest construction market in the world and seeing constant returns to scale in terms of value added (Figure 1), the initiative has been nothing short of expensive as China has experienced rising construction costs (Figure 2) alongside the increased construction volumes. Pairing this dynamic with the fact that the rate of change in construction costs has outpaced the rate of change in value added in the construction sector of the Chinese economy, has dimmed some of the lights on the utility value of the recent initiatives, and has imposed risks of possible (and developing) negative externalities on the Chinese economy (Figure 3).
Risk & Return
To extrapolate on the endogenously derived dynamic of cost inefficiency within China’s investment initiatives, let’s look at 2 outliers that have caused the most damage to the Chinese initiatives.
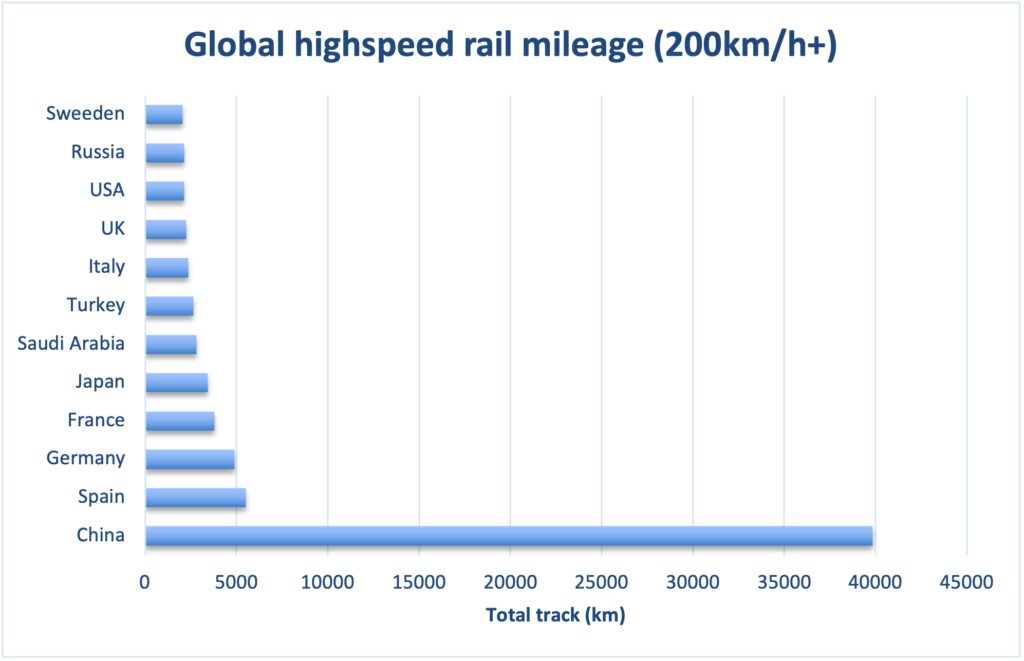
High Speed Rail Woes
As China hosts the global title for highspeed rail infrastructure (Figure 4), China has the absolute advantage when it comes to highspeed rail infrastructure; it is key to note that this is the main “export” of China’s Belt Road initiative. But as we mentioned before, big projects carry big price tags, and as China’s highspeed rail system is the largest, it is also the leader in debt and operating losses. China State Railway Group Co., Ltd, who is the state-owned enterprise that was founded by the Ministry of Railways of China and the China Railway Corporation in 2019, reported its H12021 results which showed that the company reported a healthy revenue of 512.8 billion RMB, but a net loss of 50.7 billion RMB. How is that possible with 1.33 billion passengers, an uptick of 65.5% YTD? Simply input costs, and in particular, electricity costs. With a 250km/h+ train consuming 4800 kw/h, and according to the National Bureau of Statistics of China, the price of electricity price for a high-speed train in 2019 was approximately 1 RMB/kw, but with China’s electricity costs rising in lieu of their energy supply constraints, this figure is bound to rise.
When we look at the balance sheet dynamics of China State Railway Group Co., Ltd, we can also note that the total liabilities for China State Railway Group Co., Ltd, reached 5.8 trillion RMB and their total assets sitting at 8.76 trillion RMB, but with a Gearing Ratio of 66%.
Given that the construction of China’s high-speed rails heavily relies on bond issuance and bank loans, we can further extrapolate to find that from 2016-2019 China State Railway Group Co. Ltd issued approximately 300 billion RMB in bonds per year where only 200 billion of that accumulated debt was used for maintenance and equipment purchases. The remaining amount was utilized for debt restructuring. Most of the bonds that China State Railway Group Co. Ltd issued carry a 5-year maturity term (peak issuance was in 2016). This signals that China State Railway Group Co. Ltd is at an ample risk for their Gearing ratio to substantially increase and subsequently face insolvency risks. Outside of debt-sourced funding China State Railway Group Co. Ltd also heavily relies on governmental subsidies and this dynamic has also caused strain on the fiscal health of the perspective local governments, and in particular, the western regions that experience low passenger volume and density.
Fighting Fire With Fire
Chinese local governments have sought out to combat the railway induced debt via concept cities that allocate large areas of commercial and residential development (i.e., Ordos). However, due to their remote location, economic inputs such as labor, goods and services are relatively scarce. This ultimately has led to the widely popular term of “ghost cities”. This can be extrapolated with the report from the National Bureau of Statistics of China that reads that in September 2021, investment by real estate developers fell 3.5% YoY, and apartment unit sales fell 16.9% YoY. This can be paired with the reports from the National Bureau of Statistics of China that the amount of local government debt accumulated and liabilities across China has reached a figure of 18.29 trillion RMB, and also with China Data Bank & Tencent Finance reporting that 85 Chinese cities have exceeded a 100% debt ratio in 2020, and the top 10 Chinese cities have all exceeded 500% (Guiyang as an outlier at 929%).
With the elephant in the room of Evergrande and its counterparts of Sunac China, Fantasia, and Sinic holdings, having all reported debt defaults in the past 3 payment periods. It is key to note that these companies make up the bulk of China’s real estate development volume. Pairing this with the fact that the Chinese real estate sector has a 69% share of high-yield bonds, and the Chinese high-yield bond spreads are off the 2190 (approx.) bps level and trending to re-test that level.
Moral of the Story
These credit market woes (and in addition to the recent energy crisis) in China can cause detrimental effects on the outlook of the Chinese economy and subsequently the global economy as already mentioned. Investors should be highly weary of this dynamic, particularly sovereign bond investors.
]]>As the fiscal year ends on September 30th, 2021, this is the date government funding is set to expire. In lieu of the expiration date, House Democrats passed a bill that aims to suspend the US debt ceiling into 2022, and keep the government operating until at least December 3rd, 2021. Despite the contingency plan, the House bill has faced adversity in the Senate as Senate Republicans oppose a short-term framework to raise the debt ceiling.
The game of Hardball
Despite Republican Senate leader Mitch McConnell stating in an interview that, “America must never default,” the Senator continues to lead the blockade In the measures to lift the ceiling. McConnell also stated that “The debt ceiling needs to be raised. The issue is who should do it. And under these uniquely unprecedented circumstances, it’s their obligation to do it. And they have the votes to do it, and they will do it.” So it is evident that this is a game of hardball and not so much of a binary debate on the debt ceiling.
Infrastructure Bill
This game of hardball is being played on the pitch (or the infrastructure memorial stadium for my Americans) of infrastructure. The underlying reason for the current blockade is due to the dynamic that, [McConnell] “not because it doesn’t need to be done,” but because doing so would pave the way for Democrats to pass a $3.5 trillion human infrastructure bill that would undo most of former President Donald Trump’s 2017 tax cut. In lieu of this, the Republicans have suggested a reconciliation framework to the Democrats that would allow the bill to pass with a majority vote in the Senate rather than the 60% chamber vote. The Democrats have rejected this proposition as they say that this is a bipartisan issue, [Schumer] “Anyone who says this is Democrats’ debt is not talking fact, they’re talking fiction. Both sides have a responsibility to pay for the debt we’ve already incurred.” It is also key to note that if the Democrats would proceed with the reconciliation framework, they would be virtually obligated to raise the debt limit by a specific dollar amount rather than a time-based suspension. This would put the responsibility of increasing the debt ceiling solely on Democrats, and once again risk the $3.5 trillion infrastructure bill that is already in adverse light with some Democrats.
Market Effects
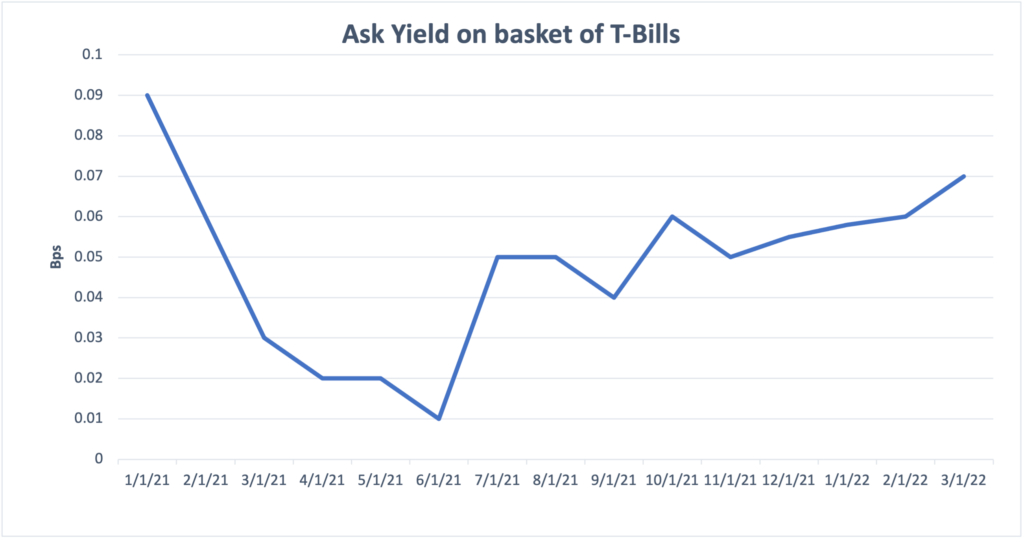
With a debt ceiling suspension, there will be an increase in net Treasury issuance of $700 billion. This $700 billion will likely be allotted between October and year-end as the treasury market yields signal issuance (Chart 1).
This could also signal that October could be home to the US Treasury’s infamous “X date”. As we discussed and foreshadowed this dynamic in https://gumbeauxcapital.com/2021/03/10/liquidity-mania-2021/ , we can further expect USD to extrapolate the impending higher rate environments it will endure.
Investors should expect higher rates across the board, and this high rate environment is at possibility of becoming “sticky” as the Fed’s tone from last week’s FOMC meeting was more on the hawkish end, along with the dynamics revolving the fiscal state of the US signaling higher yields.
The talks surrounding a tapering policy from the Federal Reserve warm up again as Individuals such as (not limited to) West Virginia’s Senator Joe Manchin, the Federal Reserve’s own Christopher Waller, and Richard Clarida have all deposited their 2 cents in regards to the Federal Reserve’s impending policy change.
It’s about the jobs!
As the press release from the most recent FOMC meeting (07/28/2021) explicitly states, “The Committee seeks to achieve maximum employment and inflation at the rate of 2 percent over the longer run. With inflation having run persistently below this longer-run goal, the Committee will aim to achieve inflation moderately above 2 percent for some time so that inflation averages 2 percent over time and longer‐term inflation expectations remain well anchored at 2 percent. The Committee expects to maintain an accommodative stance of monetary policy until these outcomes are achieved. The Committee decided to keep the target range for the federal funds rate at 0 to 1/4 percent and expects it will be appropriate to maintain this target range until labor market conditions have reached levels consistent with the Committee’s assessments of maximum employment and inflation has risen to 2 percent and is on track to moderately exceed 2 percent for some time. Last December, the Committee indicated that it would continue to increase its holdings of Treasury securities by at least $80 billion per month and of agency mortgage‐backed securities by at least $40 billion per month until substantial further progress has been made toward its maximum employment and price stability goals,” we can make the obvious assessment that the Fed has its eyes on the labor market first then inflation.
Labor dynamics
As the US July payrolls increase to 943k vs. the 870k estimate and US unemployment falling to 5.4% vs. the 5.9% estimate, it shows that the Fed’s yearn for “substantial further progress” is in reach. This report may well accentuate the tapering & tightening talk, but we cannot discount the possibility of the Fed holding until there is ample data that supports this employment. A key indicator of sustainability will be dependent on the labor force participation rate (LFPR). Even though July’s LFPR only moved up 1/10th of a percent from June’s reading, there is an interesting dynamic that underlines what the Fed may have in-front of them.
Economic shocks and LFPR
The COVID-19 economic crisis was nothing short of the quintessential economic shock as it lead to a substantially lower level of economic output, and subsequently damaging effects to the labor market cycle. At Gumbeaux Capital we stress the fact that #CyclesMatter and Tomaz Cajner, John Coglianese, and Joshua Monte provided a great deal of insight on their abstract from the Federal Reserve’s Finance and Economics Discussion Series (FEDS), as they broke down the cyclical nature of the LPFR and economic shocks. Their assessments state that, “Measuring labor market slack requires looking beyond the unemployment rate. While traditional views hold that the unemployment rate is a sufficient statistic for slack, the long-lived cyclicality of the LFPR poses problems for this view. During the period 5 to 7 years after a shock, the unemployment rate has essentially fully recovered, but the LFPR still has room to rise before it returns to its pre-shock level. Observers who focus solely on the unemployment rate during this period will incorrectly conclude that the economy has reached full employment, when in fact employment is still below potential.”

While the July jobs report, does align with the model presented by Tomaz Cajner, John Coglianese, and Joshua Monte, the key takeaway is that labor market conditions may not reach the pre-shock levels in its full magnitude until 2024-2027 in regards to LFPR in which is the derivative of the sticky employment needed to confirm a “healthy” labor market. This brings in the argument that the Fed may not be presented with the propensity to taper for the coming years, and only left with the propensity to tighten.
Note: The infrastructure bill sits as “the elephant in the room” in regards to labor, if the labor market continues to strengthen before an agreement, a taper+tighten case will appear as more likely, but if the latter comes, expect the Fed to remain relatively dovish.
Everyone’s favorite topic: Inflation
We discussed this hot topic in depth in (https://gumbeauxcapital.com/2021/05/03/uncovering-us-inflation-uncertainty/); though CPI did beat analyst consensus in July, it is still up for debate in which if inflation is transitory or not. The main point of CPI that will be under the radar for us is rent-of-shelter as the new eviction moratorium has been put in place by the Biden administration. The eviction moratorium nonetheless serves as dovish news and it will delay the full picture in the rent of shelter component in the CPI index. If CPI does consistently continue to hit above consensus, unlike employment dynamics, the Fed will be presented with the propensity to taper and tighten.
What about debt markets?
According to the Congressional Budget Office, “On August 1, 2021, the debt limit will be reset to the previous ceiling of $22.0 trillion, plus the cumulative borrowing that occurred during the period of suspension. Unless additional legislation either extends the suspension or increases the limit, existing statutes will allow the Treasury to declare a “debt issuance suspension period” and to take “extraordinary measures” to borrow additional funds for a period of time without breaching the debt ceiling. The Treasury’s cash balance and those extraordinary measures would enable it to continue financing the government’s activities for a while. However, if the debt limit remained unchanged, the ability to borrow using those measures would ultimately be exhausted, and the Treasury would probably run out of cash sometime in the first quarter of the next fiscal year (which begins on October 1, 2021), most likely in October or November, the Congressional Budget Office estimates. If that occurred, the government would be unable to pay its obligations fully, and it would delay making payments for its activities, default on its debt obligations, or both.”
(Issue)ance
The US Treasury is obligated to utilize its holdings before issuance, this indicates that the cash balance will sit at the levels seen before the suspension of the debt ceiling, so this most-likely means that US Treasuries will likely be issued at “net 0.” These dynamics will allow policymakers to buy some time to reach a deal on the debt limit. Until then, the Treasury will look to add liquidity, but with little to no effect thanks to the reverse repurchase agreements conducted by the FOMC, (which touched a record of $1.03 trillion on July 30th, 2021) in which this mechanism will act as a liquidity vacuum that will nonetheless provide a bullish case for bonds. This dynamic positions the Fed in a relatively hawkish manner and could signal a tapering scenario in the near future dependent on an agreement on the debt ceiling.
Conclusion
All in all, we all know (barring any new economic shock event) that a shift towards a more hawkish Fed is virtually inevitable. Whether it is via tapering, or rate tightening, monetary policy will be dependent on the core variables of labor, inflation, and debt. As we do expect an explicit policy shift in H1 2021, we also look to keep an eye on these variables in case of a possible hawkish surprise that may arise in Q4 2021, and or a dovish continuation through H1 2021. Setting aside the fact that Powell’s term does come to an end in February of 2022, we know that regardless of a reappointment, the Fed’s framework is exclusively derived off of data, and the upcoming economic data releases will serve as highly pivotal for the Fed and its policy stance.
As global oil demand, and subsequently, consumption begins to recoup, there are many questions about the future of oil in terms of capital markets. Many investors remain weary as to if the infamous cyclical sector will be a positive attribute to their portfolios.
Demand-Pull Dynamics
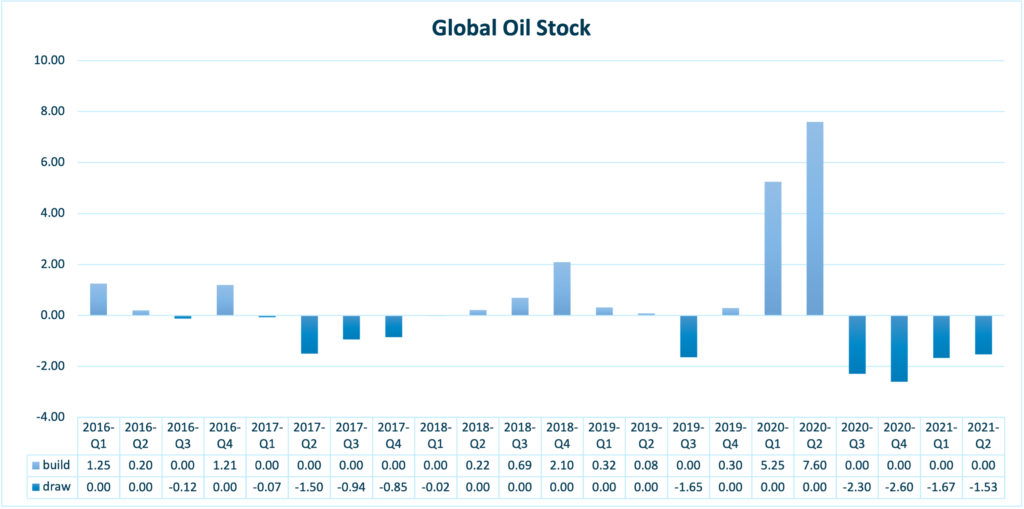
With global oil demand on its way back to “normal” levels: EIA: “U.S. gasoline consumption will average 9.1 million barrels per day (b/d) this summer (April–September), which is 1.3 million b/d more than last summer but still more than 0.4 million b/d less than summer 2019. Weekly consumption data reflect the Colonial Pipeline outage and subsequent increase in gasoline demand, but consumption both before and after this event indicate more gasoline demand than we had previously forecast. Our latest forecast also reflects IHS Markit’s increased employment forecast. We expect U.S. gasoline consumption to average 8.7 million b/d in for all of 2021 and 9.0 million b/d in 2022.” This is widely reflected within the global stock balances as the global oil stock has sit in a draw for essentially an entire fiscal year (H2 2020- H1 2021) (See Figure 1).
This in hand has been a main attribute to oil prices seeing a recent uptick which we elaborated on in:
Equity Outperformance
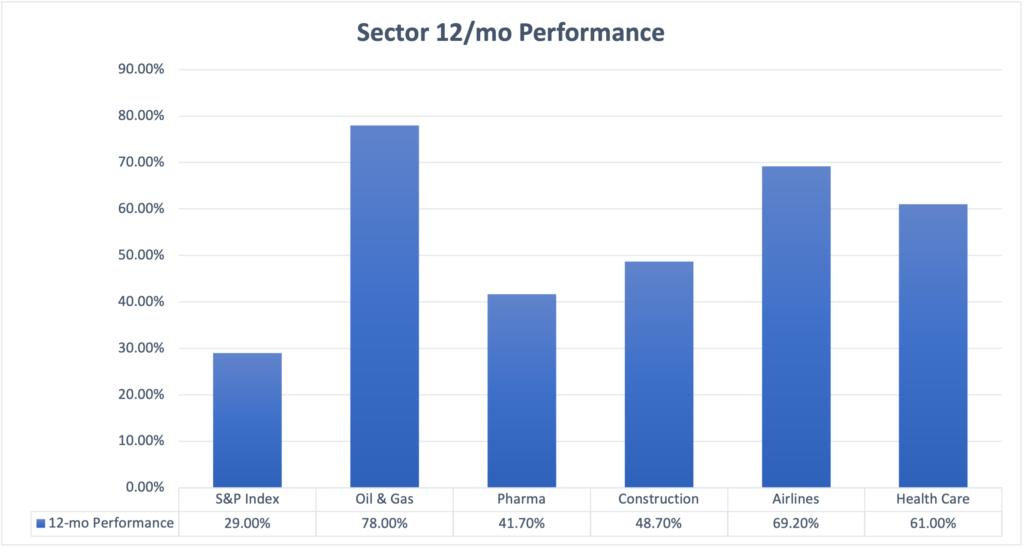
This price dynamic has led to an overall outperformance in the financial markets in 12-mo terms (see Figure 2).
“Mitigation”
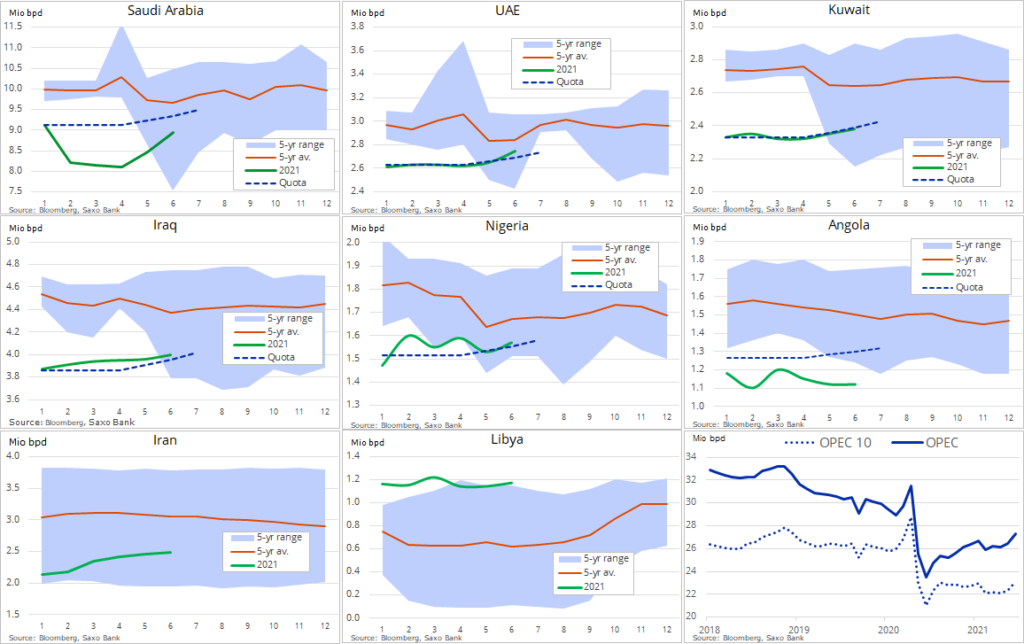
As of Friday, July 2nd 2021, the OPEC+ alliance are resuming talks about raising oil output. This is following the measurement that OPEC output has risen 855,000 barrels per day in the month of June. This brings the total OPEC daily output per day to roughly 25 million barrels (see Figure 3).
Nonetheless, OPEC+ looks to add more oil to the market from August and extend the duration of the pact on the outstanding production curbs. The only drawback being the UAE opposing the extension, and to reach an official consensus, OPEC+ requires an unanimous decision. It is key to note that the UAE does support the increase in production, but the argument in hand is derives from the quantity in production in which it wants a higher baseline. Overall this could lead to an “easing” of aggregate pricing.
What about all of the price optimism?
Analysts are eyeing in the range of $75-$100 a barrel for WTI, and Brent is already trading in at around $75 (which holds as a 2 year high). It is key to note, that regardless of the current situation, oil production is poised to substantially increase to fill imbalances within the supply chain. This will cause great amounts of volatility within oil prices, and create lots of downside risk despite the analyst consensus. On the bright side, across the board, firms in the sector are boasting record free cash-flows, and eyeing to deleverage their balance sheets in the coming months.
All in all, the oil & gas sector is approaching a “perfect-storm” in the eye of capital markets.
Investors should key firms with high (relative to sector) capital expenditures (capex), and or firms focusing on balance sheet flexibility to reap the highest quality benefits of these macro-dynamics.
Equities to watch:
Royal Dutch Shell (NYSE: RDS.A)
According to Shell’s outlook, their top priority in their capital allocation framework is:
- Apportion near-term $19-22 billion cash capital expenditure:
- Marketing ~$3 billion; Renewables and Energy Solutions $2-3 billion; Integrated Gas ~$4 billion; Chemicals and Products $4-5 billion; Upstream ~$8 billion
- Inorganic capex included in range
- ~4% dividend per share growth annually, subject to Board approval
This is a textbook example of what investors should look for in the current dynamics of the oil & gas sector.
ExxonMobil (NYSE: XOM)
On the flip side, even though Exxon has cut its capex guidance for 2021, they have focused on their balance sheet flexibility which captures the “other” strategic point in capital market attractiveness:
- Deferred 2020-25 investments of ~$50 billion; value deferred with delayed implementation
- ~90% of 2021-25 Upstream investments have cost-of-supply ≤$35/bbl
- Finalizing >$1 billion North Sea divestment; 10 assets in market
- Reduced 2020 cash Opex by18% versus 2019
Occidental Petroleum (NYSE: OXY)
Even though Occidental was one of the hardest hit firms in 2020, their guidance looks strategically poised to generate returns for investors:
- Occidental expects to invest $2.9 billion in 2021 to further strengthen the existing operations compared with $2.53 billion invested in 2020. Out of the 2021 projected capital expenditure, $1.2 billion will be invested in the Permian region to bring new wells online.
British Petroleum (NYSE: BP)
Like Exxon, BP aims to further add flexibility to their balance sheet. BP also seems to be very aggressive with cost savings, while prioritizing their maximization of EBITDA in the coming years:
- $3-4 billion of cash cost savings by 2023, relative to 2019
- Aims to almost double EBITDA by 2030 relative to 2019 while maintaining ROACE of 15-20%
- BP: “We plan to double our 2019 gross margin to more than $2bn by 2030. We plan to drive growth and margin expansion as we roll-out strategic convenience sites and enhance our retail offer supported by digital and loyalty programmes. We will make disclosures on each of these metrics.”
Connoco Phillips (NYSE: COP)
Connoco Phillips has an aggressive approach to bolster their free cash flow in the near-term:
- Conoco anticipates cash from operations of ~$145B and free cash flow of ~$70B over its 10-year plan period.
- The company also raises expected synergies savings from its deal to buy Concho Resources to $1B annually, compared with its previous forecast of $750M.